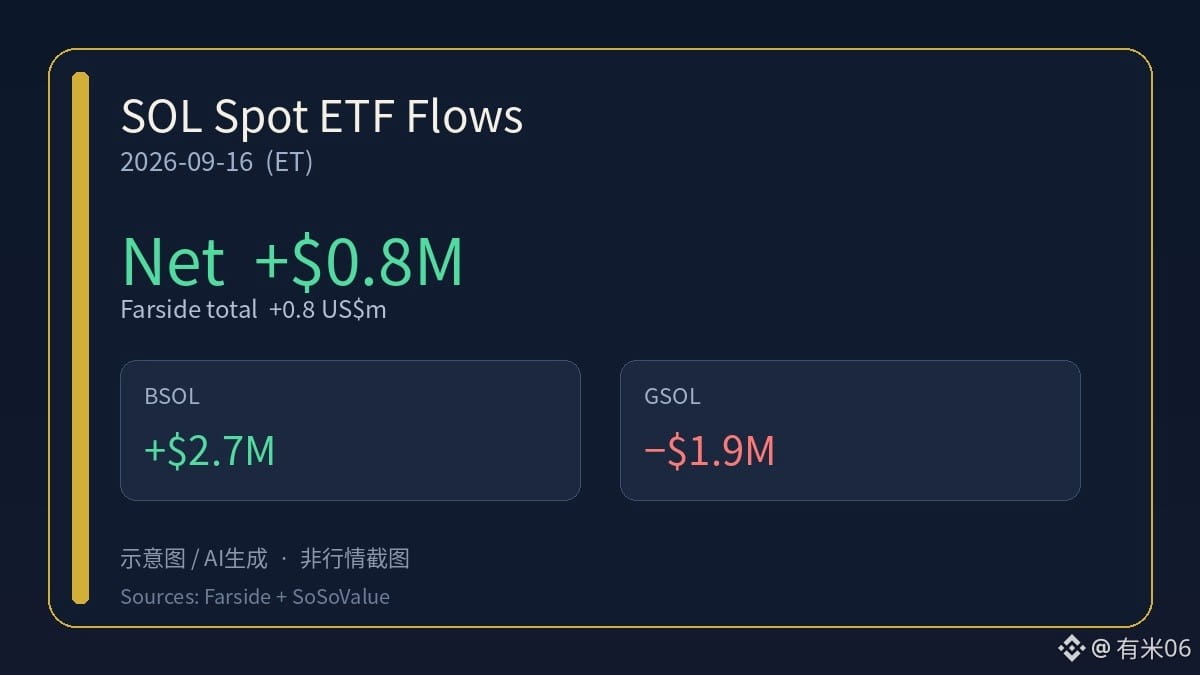
Instant conclusion: On the US East Coast 9/16, the US spot SOL ETF total still saw a slight net inflow of about US$800,000, but the structure has diverged—BSOL continued to flow in, while GSOL turned outflow on the day.
According to Farside Investors’ daily table (US East Coast 9/16, unit: US$m): total about +0.8; of which BSOL +2.7, GSOL −1.9, and the rest 0. Odaily, ChainCatcher, and PANews, citing SoSoValue using the same methodology, confirm about +$8.369 million (BSOL +2.6918 million, GSOL −1.8549 million), consistent with Farside when rounded.
Data as of: US East Coast close on 2026-09-16 (Farside daily table is complete; cross-check from two sources completed by 2026-09-17 08:41 Beijing time).
The chart is for illustration/AI-generated, not a market screenshot.
For information sharing only and does not constitute investment advice.
$SOL
#ETF #Solana #资金流
According to Farside Investors’ daily table (US East Coast 9/16, unit: US$m): total about +0.8; of which BSOL +2.7, GSOL −1.9, and the rest 0. Odaily, ChainCatcher, and PANews, citing SoSoValue using the same methodology, confirm about +$8.369 million (BSOL +2.6918 million, GSOL −1.8549 million), consistent with Farside when rounded.
Data as of: US East Coast close on 2026-09-16 (Farside daily table is complete; cross-check from two sources completed by 2026-09-17 08:41 Beijing time).
The chart is for illustration/AI-generated, not a market screenshot.
For information sharing only and does not constitute investment advice.
$SOL
#ETF #Solana #资金流