Asset analysis: Gold (XAU/USD) or PAXG/USD
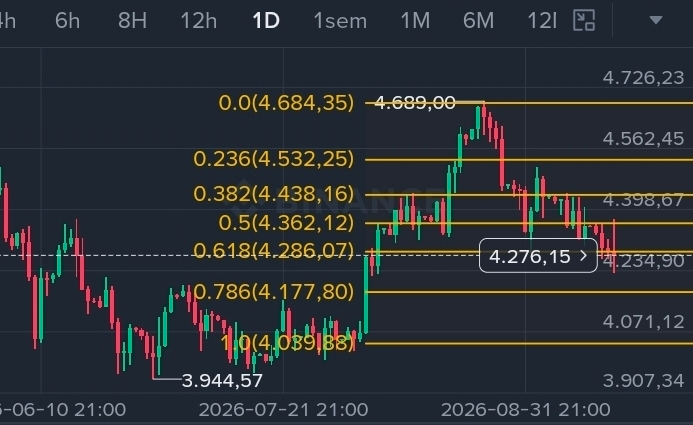
Gold (XAU/USD or PAXG/USD) trades around US$ 4,276.15 on the daily chart after pulling back from the recent high of US$ 4,689.00. On the chart, the Fibonacci Retracement tool is applied, with levels ranging from 0.0 (US$ 4,684.35) to 1.0 (US$ 4,039.88).
The current price is slightly above the 0.618 level (US$ 4,286.07), an area traditionally observed as a support zone or a possible reversal area.
Visible chart pattern and probability
A corrective move is currently in progress, starting from the high of US$ 4,689.00 toward the 0.618 area.
The probability of holding in this zone is moderate, because the 0.618 level tends to attract buyers in well-established uptrends. If price stays above US$ 4,286.07, the bullish continuation scenario gains strength, with a target toward the previous highs.
On the other hand, losing this support would pave the way to test the 0.786 level and, eventually, the retracement base at US$ 4,039.88.
Consideration about value preservation:
So, as seen, gold is an excellent preserver of value, but in real terms—discounting inflation—it does not necessarily multiply wealth in a crisis scenario; it protects.
The nominal rise is largely eroded by the high inflation that often accompanies crises and by currency depreciation. In other words, gold tends to maintain its purchasing power, not necessarily make those who hold it richer, although in deep crises it has historically outperformed inflation and currencies, especially the real.
This is a chart analysis, not an investment recommendation!
$XAUT #paxg #Fed
Gold (XAU/USD or PAXG/USD) trades around US$ 4,276.15 on the daily chart after pulling back from the recent high of US$ 4,689.00. On the chart, the Fibonacci Retracement tool is applied, with levels ranging from 0.0 (US$ 4,684.35) to 1.0 (US$ 4,039.88).
The current price is slightly above the 0.618 level (US$ 4,286.07), an area traditionally observed as a support zone or a possible reversal area.
Visible chart pattern and probability
A corrective move is currently in progress, starting from the high of US$ 4,689.00 toward the 0.618 area.
The probability of holding in this zone is moderate, because the 0.618 level tends to attract buyers in well-established uptrends. If price stays above US$ 4,286.07, the bullish continuation scenario gains strength, with a target toward the previous highs.
On the other hand, losing this support would pave the way to test the 0.786 level and, eventually, the retracement base at US$ 4,039.88.
Consideration about value preservation:
So, as seen, gold is an excellent preserver of value, but in real terms—discounting inflation—it does not necessarily multiply wealth in a crisis scenario; it protects.
The nominal rise is largely eroded by the high inflation that often accompanies crises and by currency depreciation. In other words, gold tends to maintain its purchasing power, not necessarily make those who hold it richer, although in deep crises it has historically outperformed inflation and currencies, especially the real.
This is a chart analysis, not an investment recommendation!
$XAUT #paxg #Fed