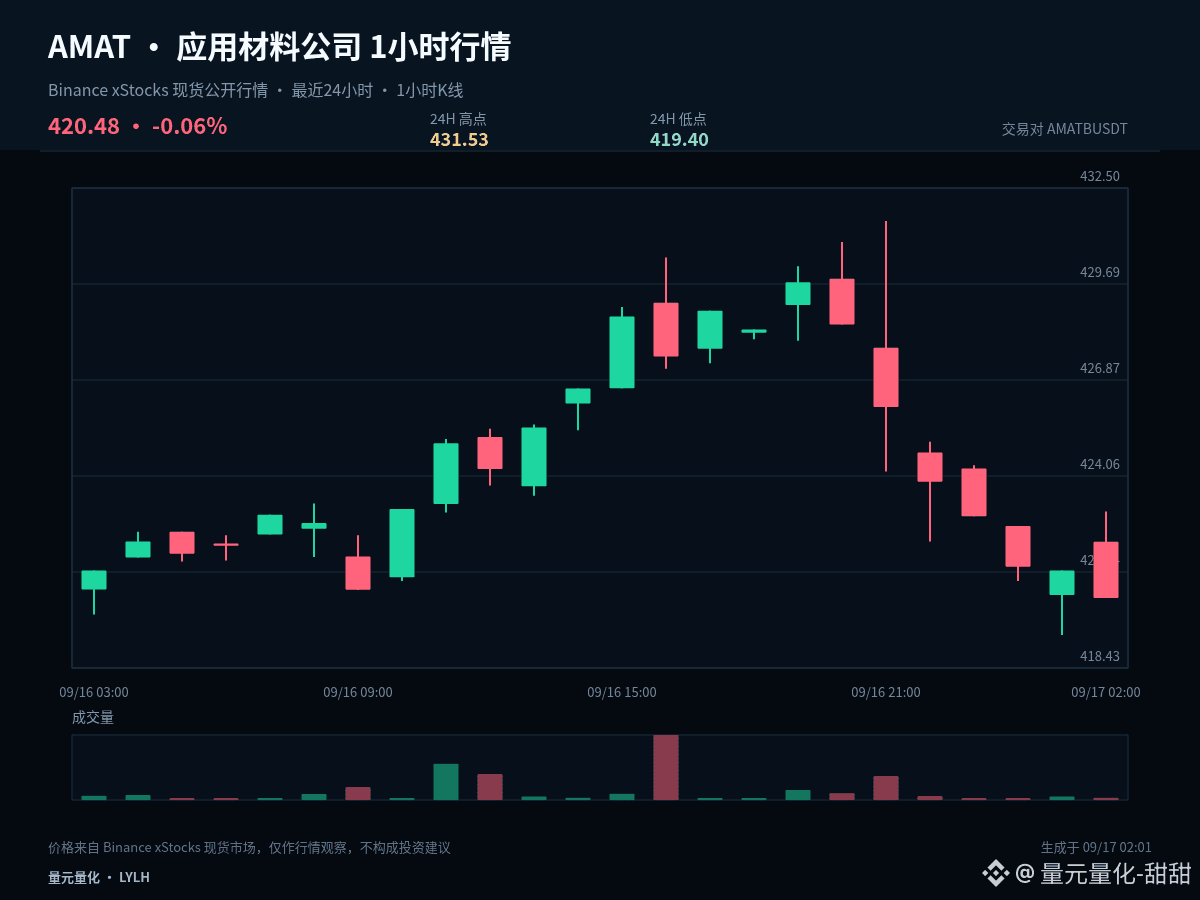
$AMATB #AMAT If I have to keep only one observation price for this round, I’d choose 425.465. The current price is 420.48; in the past 1 hour -0.19%, and in the past 24 hours +0.12%. The gains and losses around the mid-axis can help filter a lot of intraday noise.
The price hasn’t yet recovered 425.465. For now, treat the current rebound as a weak repair; a true turn for the strong needs to be proven by a stable close. If it turns weak again, 419.4 is the next level to observe whether the sell pressure is fading.
The current price is near the lower bound of the last 24-hour range: 1 hour -0.19%, 24 hours +0.12%. The core of low-level analysis isn’t trying to bottom early; it’s watching whether it can quickly reclaim after breaking down. If it can reclaim, that suggests the sell pressure has been absorbed; if it keeps staying below the lower bound, it indicates weakness hasn’t ended.
My scenario isn’t betting on just one direction. If the price breaks above 431.53 and can hold, it means the upside room has been reopened. If it breaks below 419.4 and fails to rebound, it means the structure has turned weaker further. If it trades between the two, continue to observe the closing behavior on both sides of 425.465.
Position management needs to distinguish between medium-term and short-term. For existing medium-term positions, first check whether the structure is broken; don’t let repeated fluctuations on a single 1-hour candlestick keep distracting you. For short-term positions, execute around support, resistance, and confirmation by closes. If you’re currently in cash, you don’t need to chase the price in the middle of the range—waiting for clearer levels usually has an advantage.
For the next 1-hour candle: if it closes above 425.465, the structure will be more proactive; if it closes below, stay cautious. Which path are you leaning toward?
#ZcashHoldersBackNU7Upgrade
The price hasn’t yet recovered 425.465. For now, treat the current rebound as a weak repair; a true turn for the strong needs to be proven by a stable close. If it turns weak again, 419.4 is the next level to observe whether the sell pressure is fading.
The current price is near the lower bound of the last 24-hour range: 1 hour -0.19%, 24 hours +0.12%. The core of low-level analysis isn’t trying to bottom early; it’s watching whether it can quickly reclaim after breaking down. If it can reclaim, that suggests the sell pressure has been absorbed; if it keeps staying below the lower bound, it indicates weakness hasn’t ended.
My scenario isn’t betting on just one direction. If the price breaks above 431.53 and can hold, it means the upside room has been reopened. If it breaks below 419.4 and fails to rebound, it means the structure has turned weaker further. If it trades between the two, continue to observe the closing behavior on both sides of 425.465.
Position management needs to distinguish between medium-term and short-term. For existing medium-term positions, first check whether the structure is broken; don’t let repeated fluctuations on a single 1-hour candlestick keep distracting you. For short-term positions, execute around support, resistance, and confirmation by closes. If you’re currently in cash, you don’t need to chase the price in the middle of the range—waiting for clearer levels usually has an advantage.
For the next 1-hour candle: if it closes above 425.465, the structure will be more proactive; if it closes below, stay cautious. Which path are you leaning toward?
#ZcashHoldersBackNU7Upgrade