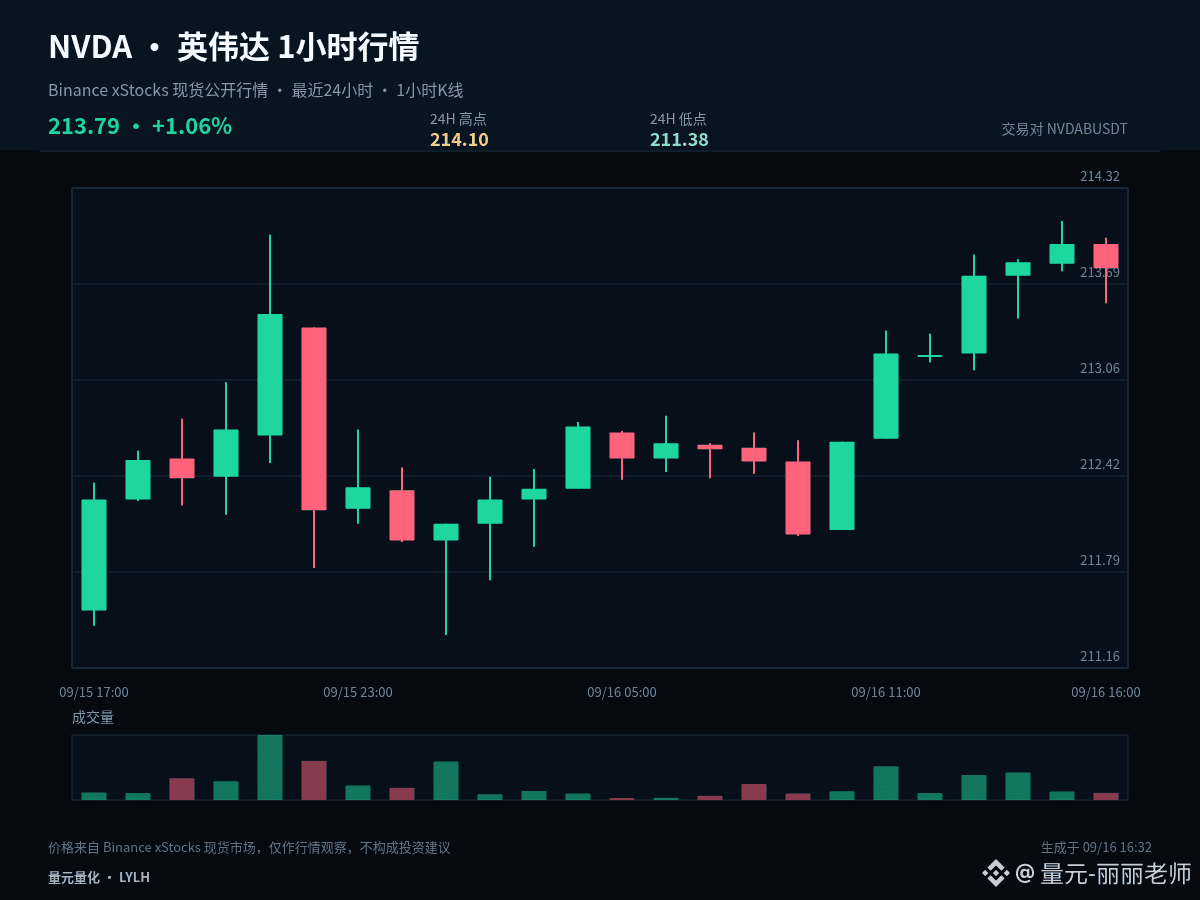
$NVDAB #NVDA This time, we’ll break it down from the perspective of positions. In the same chart, the key points you see with an existing position versus being in cash are different. Current price: 213.79, 1-hour: -0.07%, 24-hour: +1.10%.
The current price is near the upper band of the last 24-hour range: 1-hour -0.07%, 24-hour +1.10%. The most important thing at the highs is to confirm acceptance after a breakout: if price can stay above the upper band, the market is acknowledging a higher trading range; if it only briefly pierces and then quickly reclaims, you need to guard against a false breakout.
For those already holding positions, watch whether 211.38 breaks down—if it does, reduce risk exposure first. For those in cash, wait for the low point to stop moving lower and confirm that the price has risen back above 212.74; don’t “catch” early while the downward structure is still unfolding.
Execution should set clear conditions: after breaking above 214.1, you need confirmation—don’t chase just because you see a momentary surge. After dipping to 211.38, you need to see whether it can quickly reclaim—don’t buy just because you see it down. If the mid-range doesn’t offer sufficient odds, waiting is also part of the strategy.
Position management should distinguish between swing/medium-term and short-term. For existing medium-term positions, first check whether the structure is broken; don’t let repeated fluctuations on single 1-hour candles keep influencing you. For short-term positions, execute based on support, resistance, and close confirmation. If you’re in cash, there’s no need to chase prices in the middle of the range—waiting for a clearer level usually gives an advantage.
For short-term positioning, the focus isn’t to predict every single candlestick. Instead, it’s to ensure there’s a basis for entry, scaling down, and exiting. If there’s no confirmation, do less. If a key level fails, redo the plan—control risk per trade first, then discuss the potential upside.
#FedRateWatch
The current price is near the upper band of the last 24-hour range: 1-hour -0.07%, 24-hour +1.10%. The most important thing at the highs is to confirm acceptance after a breakout: if price can stay above the upper band, the market is acknowledging a higher trading range; if it only briefly pierces and then quickly reclaims, you need to guard against a false breakout.
For those already holding positions, watch whether 211.38 breaks down—if it does, reduce risk exposure first. For those in cash, wait for the low point to stop moving lower and confirm that the price has risen back above 212.74; don’t “catch” early while the downward structure is still unfolding.
Execution should set clear conditions: after breaking above 214.1, you need confirmation—don’t chase just because you see a momentary surge. After dipping to 211.38, you need to see whether it can quickly reclaim—don’t buy just because you see it down. If the mid-range doesn’t offer sufficient odds, waiting is also part of the strategy.
Position management should distinguish between swing/medium-term and short-term. For existing medium-term positions, first check whether the structure is broken; don’t let repeated fluctuations on single 1-hour candles keep influencing you. For short-term positions, execute based on support, resistance, and close confirmation. If you’re in cash, there’s no need to chase prices in the middle of the range—waiting for a clearer level usually gives an advantage.
For short-term positioning, the focus isn’t to predict every single candlestick. Instead, it’s to ensure there’s a basis for entry, scaling down, and exiting. If there’s no confirmation, do less. If a key level fails, redo the plan—control risk per trade first, then discuss the potential upside.
#FedRateWatch