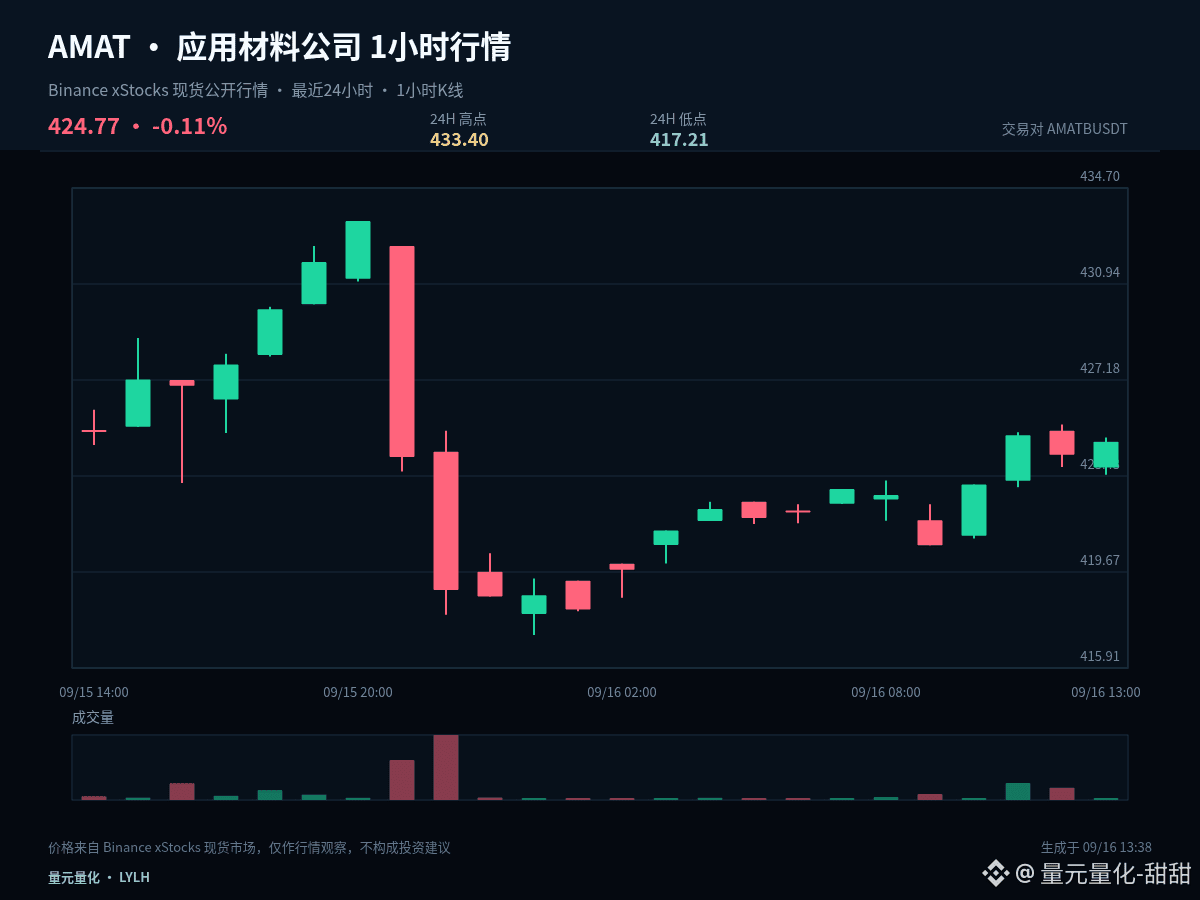
$AMATB #AMAT Order book notes: current price 424.77, 1 hour +0.12%, 24 hours +0.09%, and the amplitude over the past 24 hours is about 3.8%. First, write down the data and my assessment for this moment; we’ll validate it with the price action later.
$AMATB #AMAT is still rotating within the range over the past 24 hours, with no clear directional advantage. The middle area is the biggest test of patience—waiting for boundary signals is usually more effective.
For key levels: 425.305 is the current structure’s central axis and the first benchmark to judge whether a pullback is healthy. As long as the price can stay steadily above it, the bulls still retain initiative. On the upside, the first target to watch is 433.4. If price falls back below the central axis, then attention should shift to the second support at 417.21.
My scenario analysis is not a single-direction bet. A breakout above 433.4 and holding it means upside room has been reopened; a breakdown below 417.21 with no successful retest implies the structure is weakening further. If it moves between these two levels, continue to observe the closes on both sides of 425.305.
When reviewing later, I’ll check three things: how price reacts when it first approaches a key level, whether the 1-hour close completes the confirmation, and whether I adjust the plan according to schedule after my thesis is invalidated. Compared with only recording outcomes, these three items reveal execution problems more effectively.
For short-term positioning, the focus is not to predict every single candlestick. It’s to ensure there’s a basis for entry, reducing exposure, and exit. Do less without confirmation; if key levels fail, redo the plan—control single-trade risk first, then talk about the subsequent upside space.
#StrategyMarketCapPassesFord
$AMATB #AMAT is still rotating within the range over the past 24 hours, with no clear directional advantage. The middle area is the biggest test of patience—waiting for boundary signals is usually more effective.
For key levels: 425.305 is the current structure’s central axis and the first benchmark to judge whether a pullback is healthy. As long as the price can stay steadily above it, the bulls still retain initiative. On the upside, the first target to watch is 433.4. If price falls back below the central axis, then attention should shift to the second support at 417.21.
My scenario analysis is not a single-direction bet. A breakout above 433.4 and holding it means upside room has been reopened; a breakdown below 417.21 with no successful retest implies the structure is weakening further. If it moves between these two levels, continue to observe the closes on both sides of 425.305.
When reviewing later, I’ll check three things: how price reacts when it first approaches a key level, whether the 1-hour close completes the confirmation, and whether I adjust the plan according to schedule after my thesis is invalidated. Compared with only recording outcomes, these three items reveal execution problems more effectively.
For short-term positioning, the focus is not to predict every single candlestick. It’s to ensure there’s a basis for entry, reducing exposure, and exit. Do less without confirmation; if key levels fail, redo the plan—control single-trade risk first, then talk about the subsequent upside space.
#StrategyMarketCapPassesFord