



Bitcoin breaks through key support: is 75,500 USD the bottom—or a trap?
Last night, the broad market dropped as expected, confirming our accurate prediction in the previous episode. A high-volume daily long bearish candle from Bitcoin directly broke through the prior parallel low support and probed down to 75,500 USD to establish a new low. Although the closing price is temporarily staying above that level and has not yet set a lower record, that doesn’t mean the selloff has already stabilized or upgraded into a bottom. The current market remains extremely fragile.
Based on a deeper analysis of the order book technical picture, during the recent price decline, the CVD (cumulative volume delta) saw a brief uptick, while OI (open interest) continued to rise. This suggests a large number of retail traders are “catching falling knives” and blindly bottom-fishing against the trend. When the funding rate has not yet turned negative—or is still at relatively low levels—and retail traders are frequently going long on dips, this “contrarian” condition becomes a primary concern for longs. It’s crucial to guard against the risk of a second pullback.
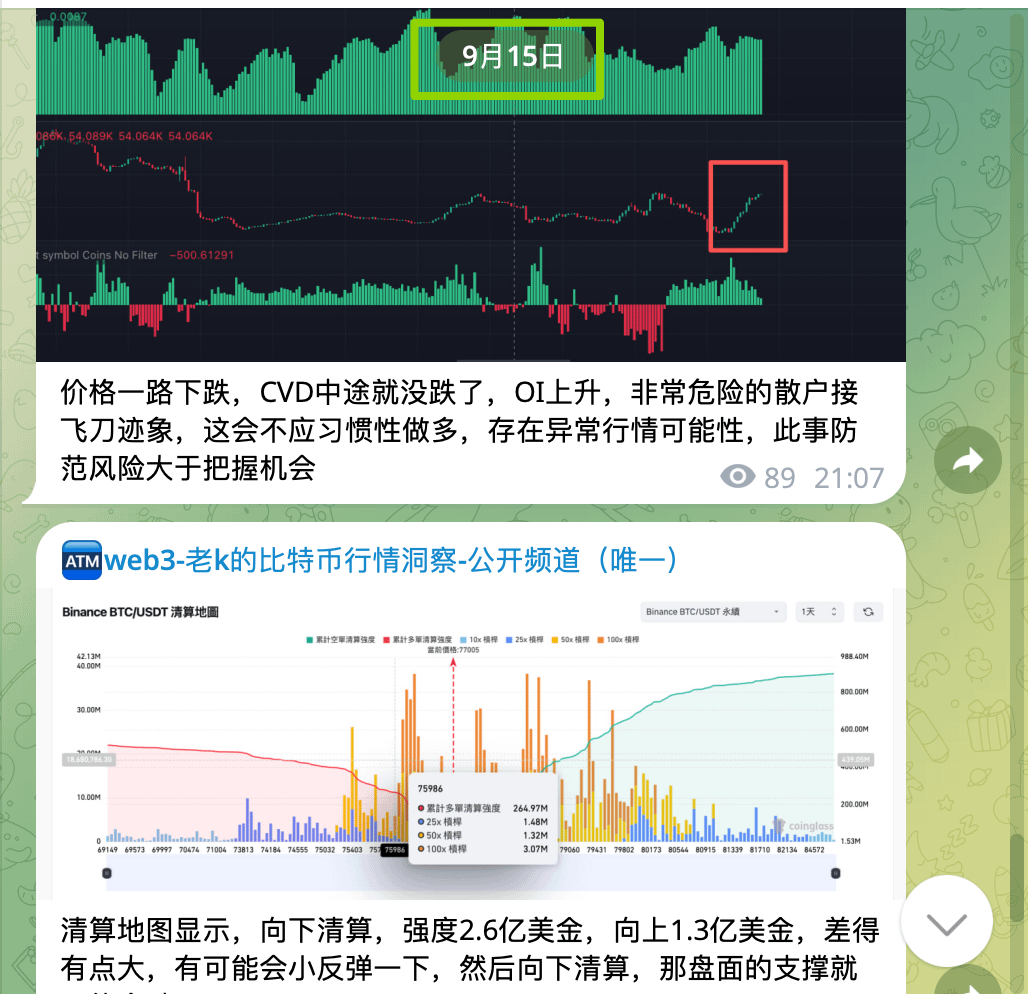
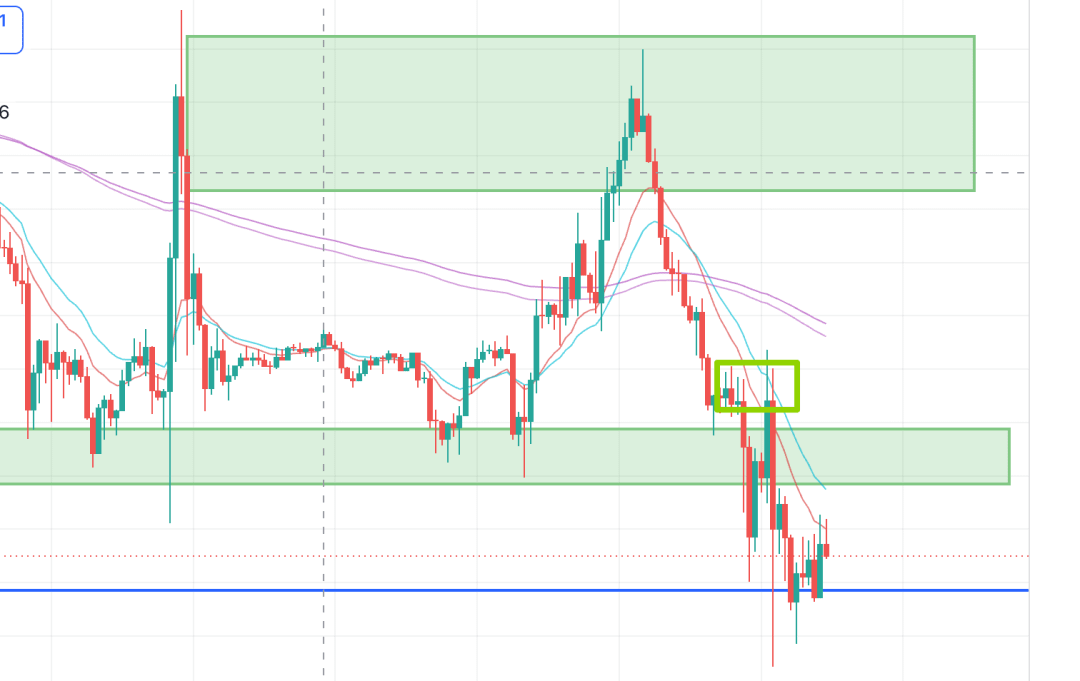
In addition, the liquidation map shows that the $260 million long leverage was quickly liquidated during this needle move. Meanwhile, the $130 million short liquidation above briefly touched near $77,300 in the middle of the night, but then quickly faced selling pressure and fell back. The previous key support level (around $76,600) has officially turned into the current rebound resistance.
From the hourly timeframe, the EMA 9 and EMA 12 moving averages are continuously suppressing price. On the 15-minute chart, there are short-lived volume surges and a Pinbar hammer pattern, but neither has managed to form a sustained upside breakout.
Macro conditions and capital flows in sync: wait for the rate decision and ETF buy-side confirmation
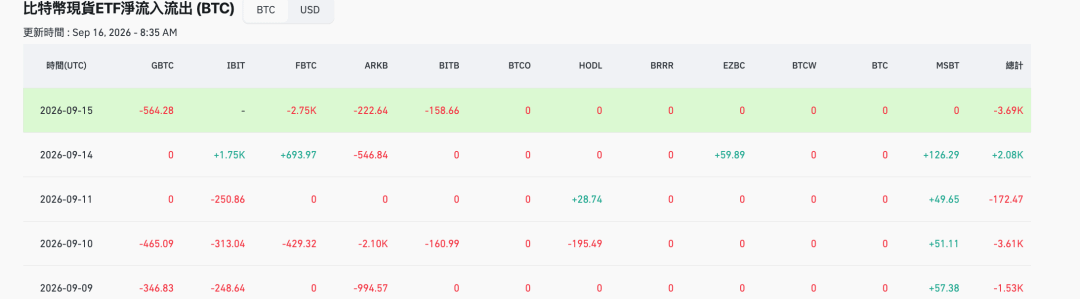
To confirm that a bottom is established, it takes not only technical recovery of a “higher base, higher top” structure, but also cooperation from macro capital flows and solid, real buy orders. Right now, the whole market is closely watching the Federal Reserve’s rate decision meeting (FOMC) on September 18 and the trajectory of the latest dot plot. Meanwhile, the spot ETF capital side is weak: not only are major funds such as IBIT showing synchronous declines and large net outflows (estimated daily net outflow close to 7,000 BTC), but the total amount of stablecoins in the venue is also gradually shrinking, revealing the risk of insufficient buy-side follow-through.
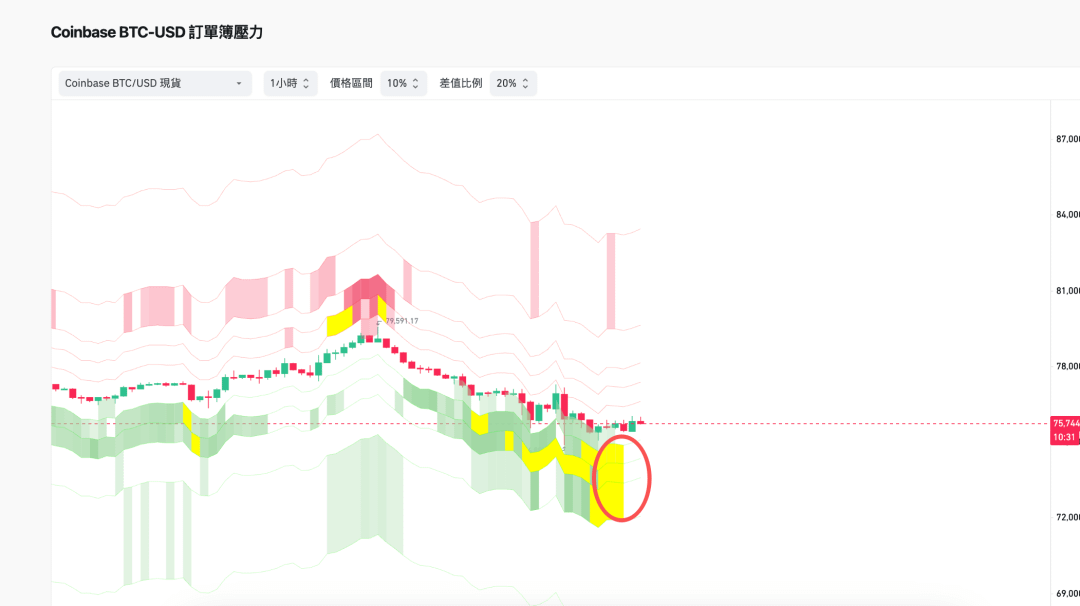
The order book also sends dangerous signals: although there are occasional rebounds on the futures side, the spot CVD sell pressure is fierce. Meanwhile, below major exchanges such as Coinbase, the limit buy orders (Limit Orders) are being withdrawn one after another, and buy-side depth has clearly thinned. With retail investors typically chasing longs mechanically and lacking sentiment to chase shorts, major funds often tend to sweep out this portion of long leverage.
If, over the coming days, Bitcoin cannot regain the $76,600 resistance with strong volume and also receive a renewed net inflow from ETFs, the price action may face further deep downside. At that time, the 200-day moving average (200MA) area—which is a key boundary between bull and bear—will likely coincide with the parallel highs formed from the earlier bottom, creating an excellent extreme pullback-and-spot-absorption zone.
Regarding the trading strategy: if you have sufficient capital, you can build positions in batches; if your capital is limited, it’s recommended to be patient and wait until macro uncertainty clears and both the technical and capital sides stabilize before getting involved. After all, what we are betting on is a super bull market of $200,000 to $300,000—or even higher in the future—so don’t blindly bottom-fish before confirmation signals appear.
Prior strategy accuracy verified: real-world performance of the VIP community and the group
Looking back at our recent layout, our strategy has once again received perfect validation from the market. At Bitcoin’s prior high area, in our VIP group we accurately highlighted a short-sell setup at $78,400. The partners who followed it have all successfully taken profit and exited. Not only that, in the cross-asset allocation in the U.S. stock market, the targets we pointed out such as Micron (Micron) and SX have also delivered huge gains one after another. In recent weeks, three consecutive strategy trades have achieved impressive returns!

To help everyone precisely grasp the rhythm at the critical bottom-fishing moment in the future, Old K’s public community and the VIP community remain continuously open. The public group is completely free and provides daily real-time updates and market analysis. The VIP group also requires no fee to join—only through exchange rebates. We will never charge any extra group fees. If you want to get more forward-looking analysis and precise entry points, feel free to contact us via the details page at any time.
U.S. stocks and the AI sector: a medium-to-long-term hedge asset amid short-term political sentiment disruptions
In the U.S. stock market, the broader index is currently hovering around the critical life-or-death threshold at 29,000. The rate decision meeting on September 18 will be the key test for the pressure-bearing ability of the overvalued AI sector. Judging from recent capital flows, some funds have rotated from pure-model and optical module sectors into platform and software-type companies that have more certain operating income. This suggests that hedging funds have not completely left AI; instead, they are seeking a more stable harbor within U.S. equities.
From a deeper level of politics and fundamentals, with the U.S. midterm elections approaching, candidates may slow the construction pace of AI data centers in their public messaging to cater to voter sentiment (e.g., reducing community environmental disruption caused by IDC data center development). This temporary hesitation in policy and public opinion may weigh on the performance of the optical module, hardware, storage, and DRAM supply chains in the short term. However, AI is an irreversible long-term direction as a cross-era core national strategy (such as the “Stargate” plan advocated by Trump). This short-term pullback, in fact, provides us with an excellent opportunity to accumulate high-quality AI assets at bargain prices halfway up the mountain. By mastering core AI assets, you’re not only sharing in technology dividends—you’re also buying a powerful insurance for human assets in the AI era.
Gold shows a breakout-from-below and reversal: the daily “Morning Star” triggers the signal to add longs
Finally, keep an eye on the gold market. Previously, there were concerns that gold might break below the head-and-shoulders bottom structure. At the time, Old K clearly stated: unless the daily timeframe closes and opens below the key support ($4,300), you cannot take an overly bearish view blindly. As expected, gold not only holds steadily above support, but has already been the first to move into a strong “breakdown-and-reversal” pattern.
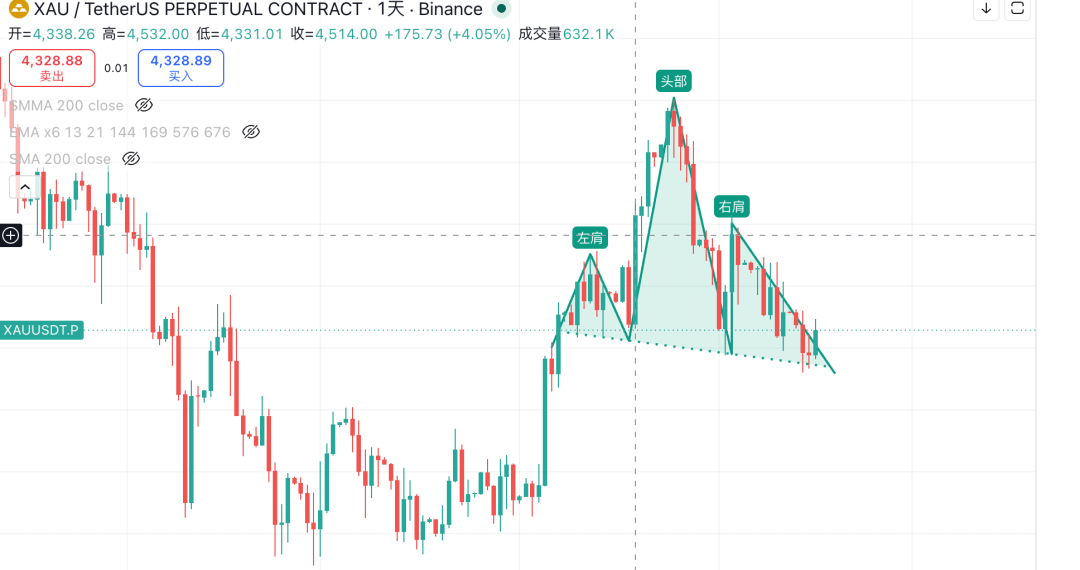
Currently, the daily gold candlestick level has successfully formed the standard “Morning Star” (Morning Star) candlestick pattern. If the reversal signals from these three candlesticks are further confirmed in the subsequent trading days, we will get an excellent technical opportunity to add long positions in gold again.
❀❀END❀❀