【 $BTC four-year cycle total mark series 68】
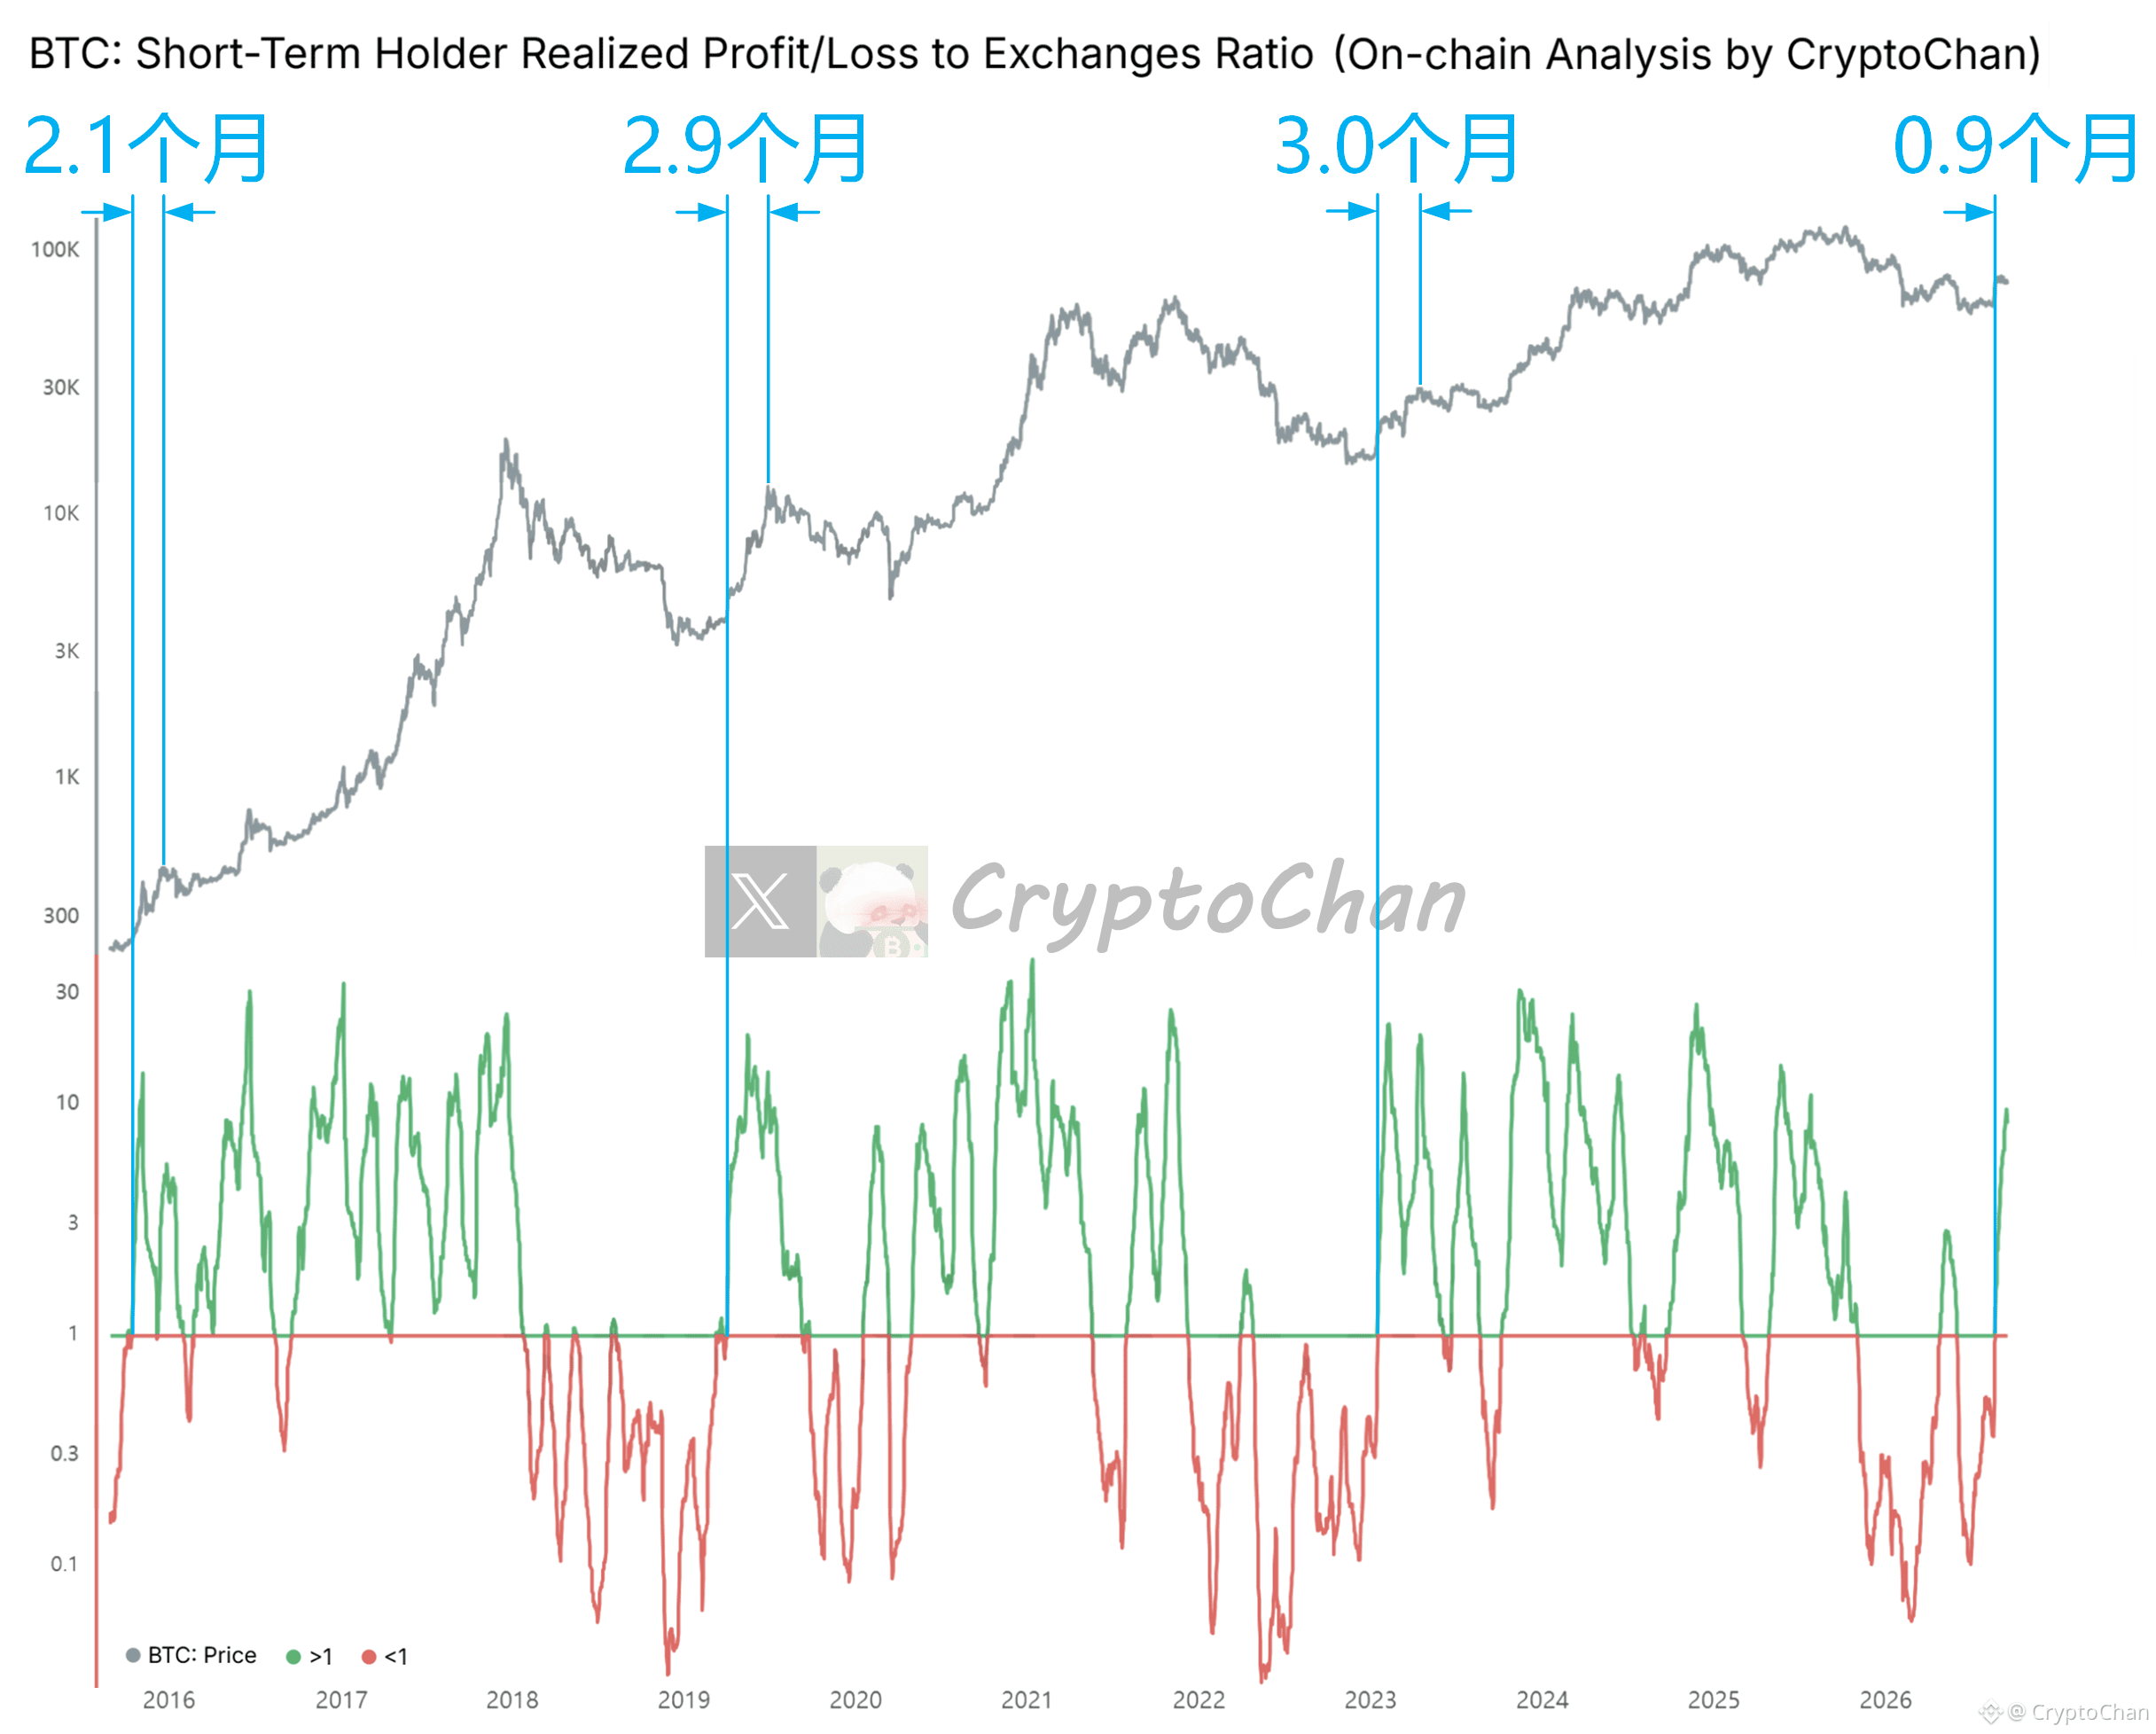
2015 bear-market bottom, right side: after the red-to-green shift, 2.1 months to the peak of the bull-market recovery phase
2019 bear-market bottom, right side: after the red-to-green shift, 2.9 months to the peak of the bull-market recovery phase
2023 bear-market bottom, right side: after the red-to-green shift, 3.0 months to the secondary peak of the bull-market recovery phase
2026 bear-market bottom, right side: red-to-green has already lasted 0.9 months
┌── 🐼 On-chain data details ──┐
The indicator at the bottom of the chart is the “Bitcoin short-term investor transfer-to-exchange profit/loss ratio,” i.e., the profit achieved when on-chain short-term investors move coins into an exchange ÷ realized losses (30-day moving average)
>1 (green): mainly profit-taking
<1 (red): mainly stop-loss / capitulation
2015 bear-market bottom, right side: after the red-to-green shift, 2.1 months to the peak of the bull-market recovery phase
2019 bear-market bottom, right side: after the red-to-green shift, 2.9 months to the peak of the bull-market recovery phase
2023 bear-market bottom, right side: after the red-to-green shift, 3.0 months to the secondary peak of the bull-market recovery phase
2026 bear-market bottom, right side: red-to-green has already lasted 0.9 months
┌── 🐼 On-chain data details ──┐
The indicator at the bottom of the chart is the “Bitcoin short-term investor transfer-to-exchange profit/loss ratio,” i.e., the profit achieved when on-chain short-term investors move coins into an exchange ÷ realized losses (30-day moving average)
>1 (green): mainly profit-taking
<1 (red): mainly stop-loss / capitulation