$BTC
Hello, good morning everyone (first, let’s find the key levels—our trading view is at the end)
Now everyone should have a question mark in their head ❓
So, is Big Biscuit (BTC) really starting a reversal and moving into the right-side行情?
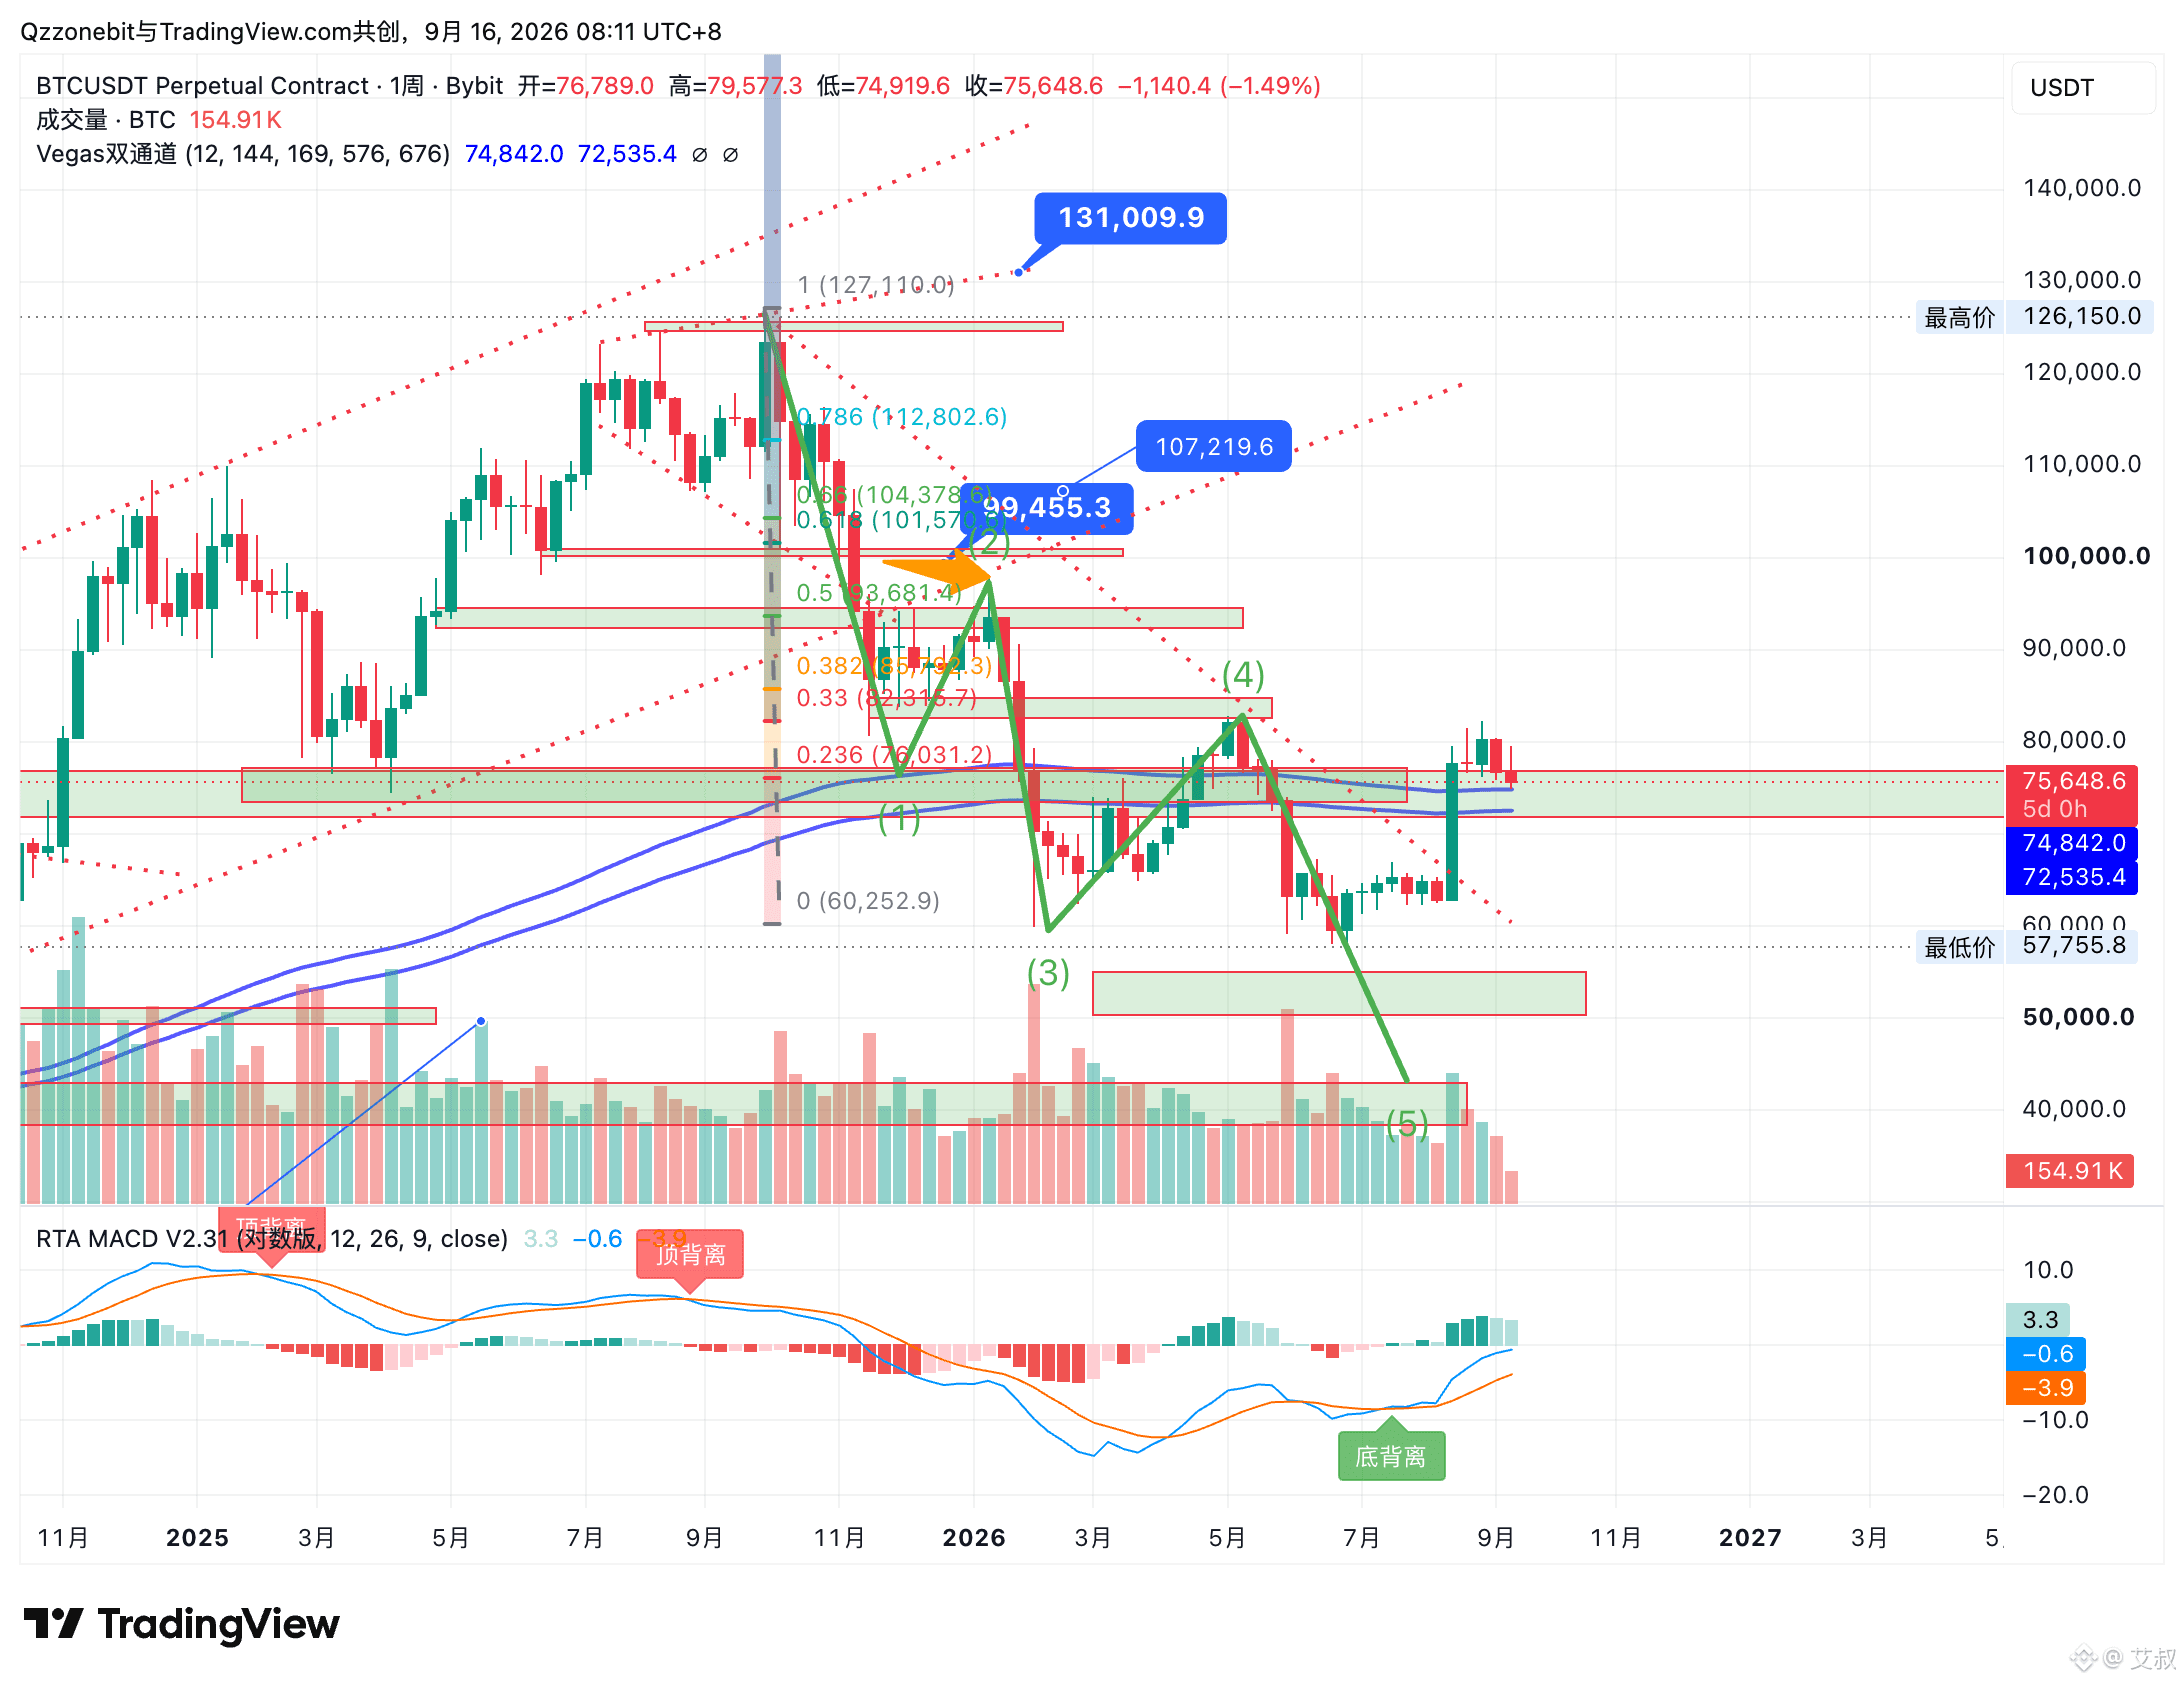
1. From a weekly perspective: since last October, the decline must be reclaimed and reclaimed strengthfully—standing above 825 is required. This is the signal that the bulls can start a counterattack. Also, the weekly stop-rug/turning zone is farther out: it needs to absorb the 0.618 retracement. Coincidentally, this is also at a resonance point on the channel line.
2. Since the trendline has already formed, is there still room for new lows? This is where technical analysis comes in: only a valid breakout is one where price retests but does not break the level after the trendline is broken. So, to judge whether new lows are still possible: first look whether price can recover the stop-rug/turning level; then look at how the support level moves below.
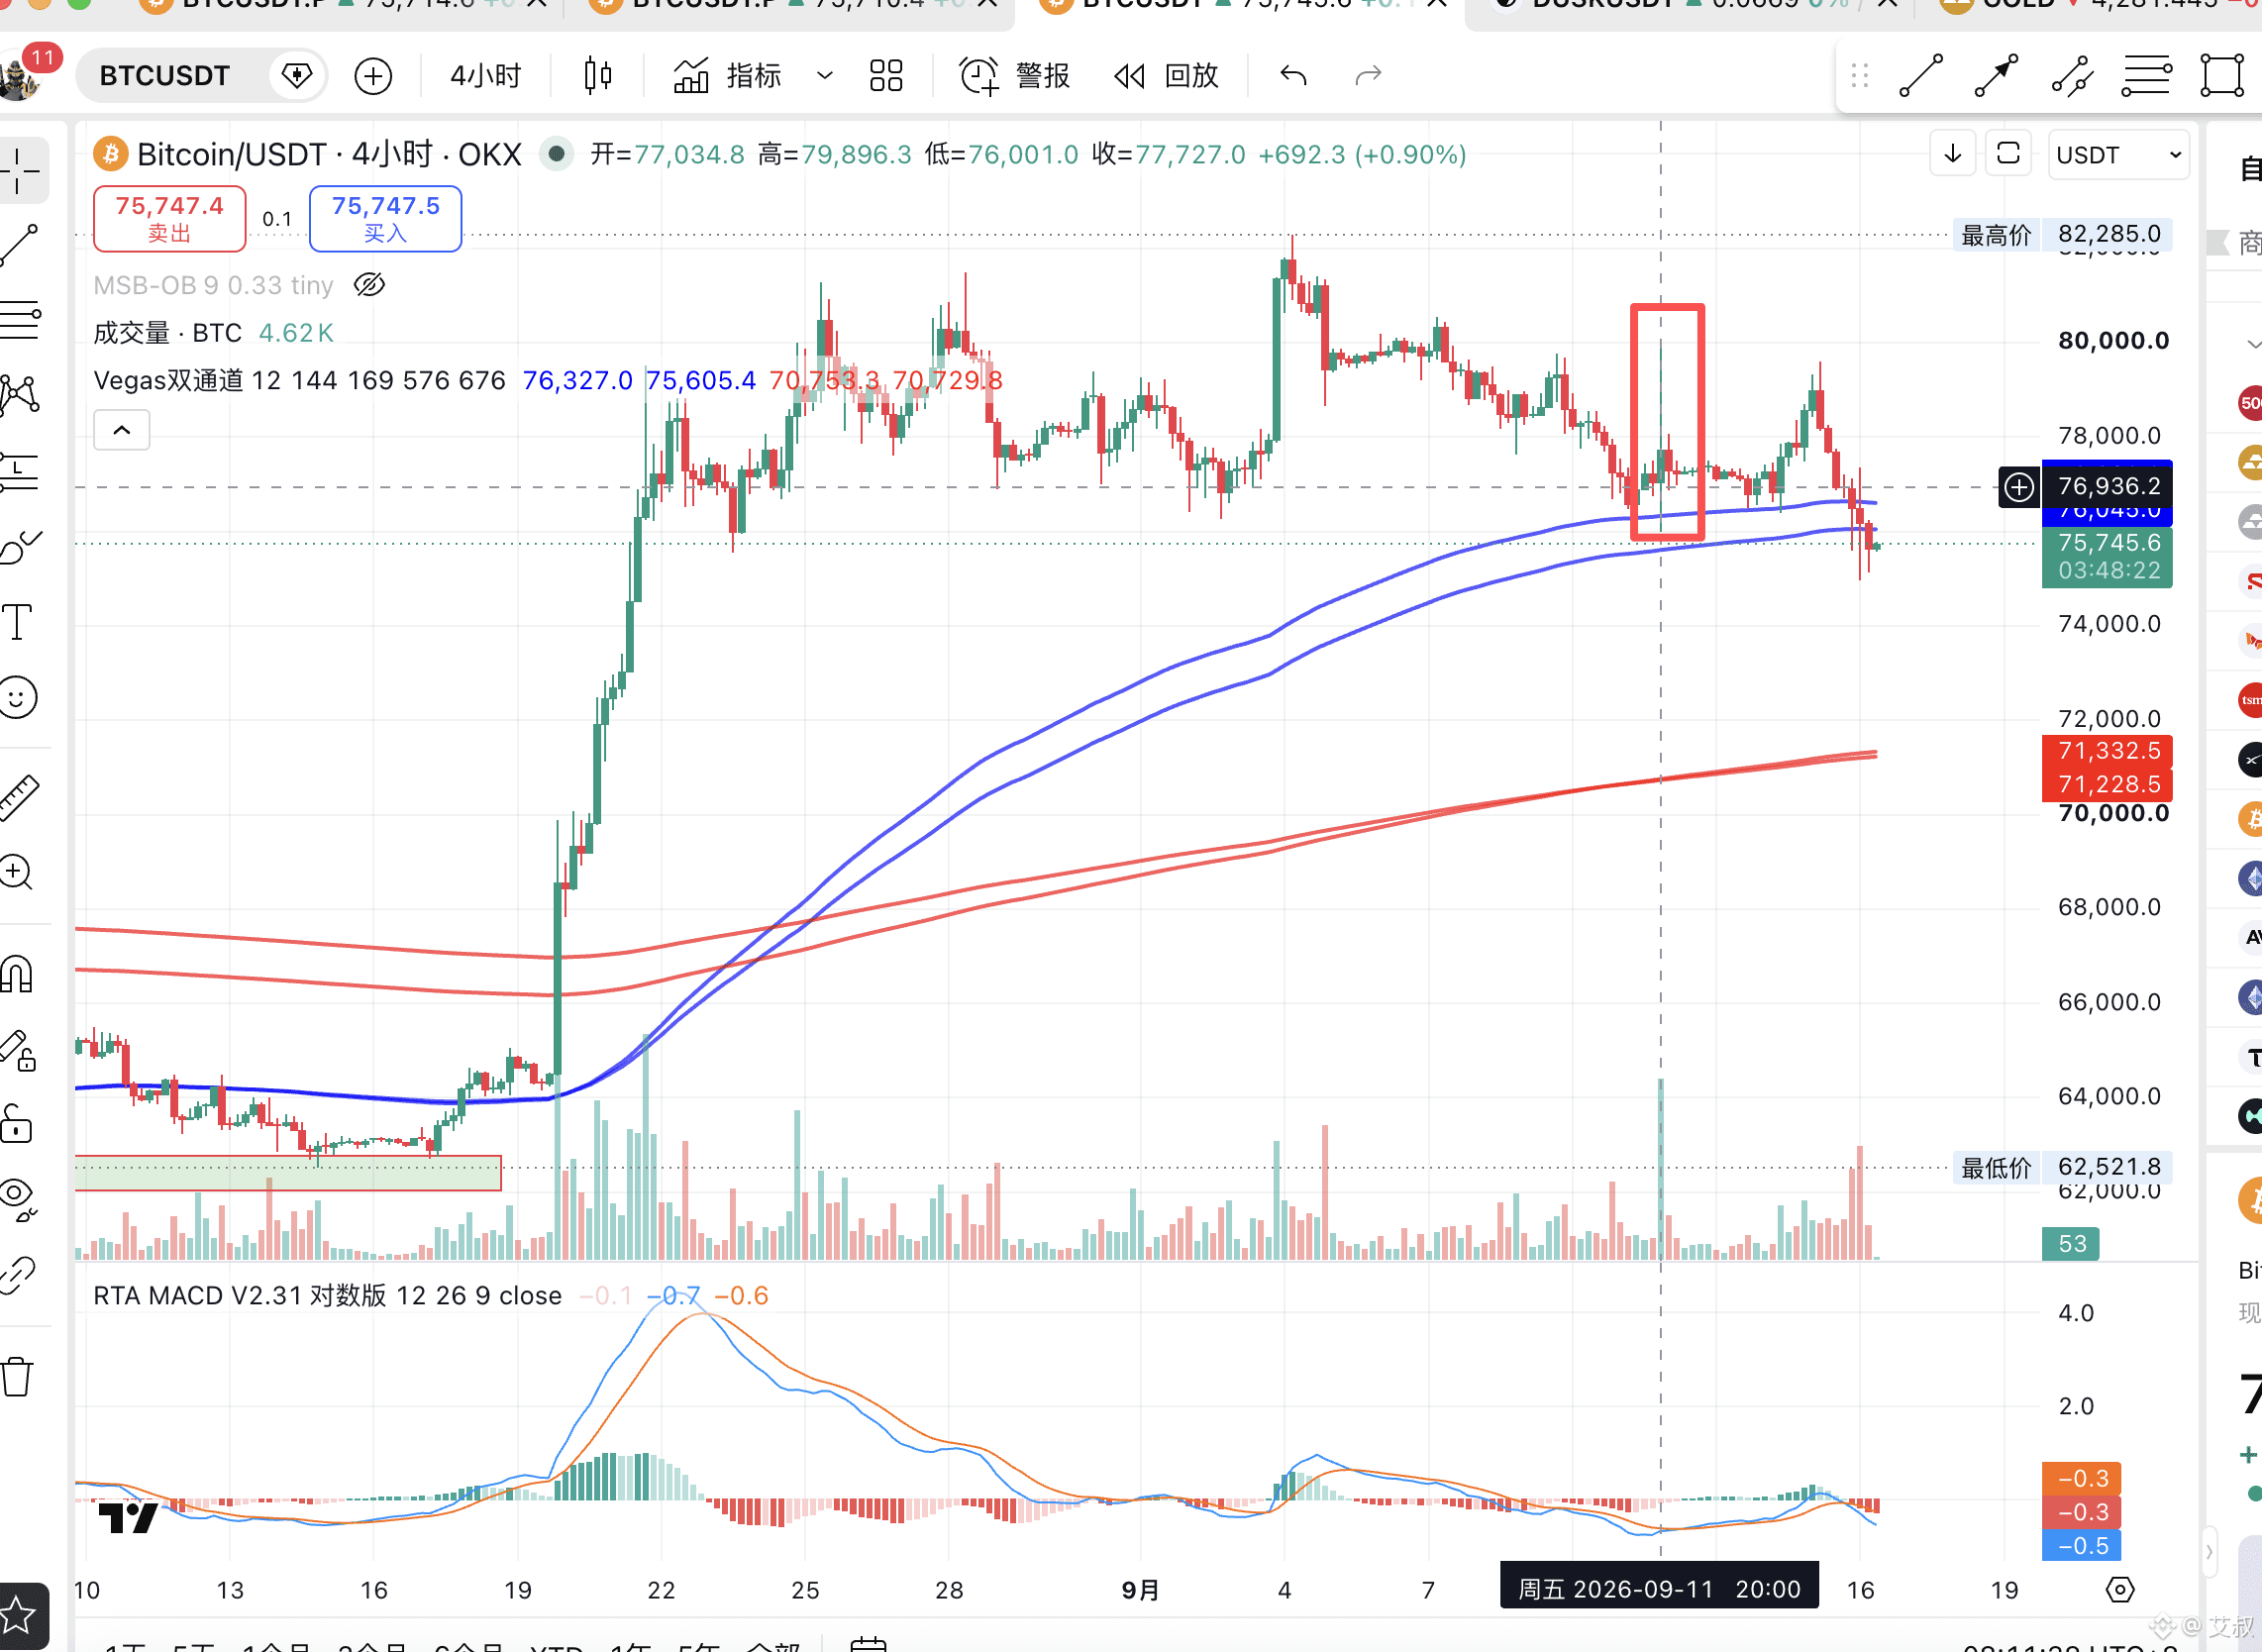
3. Chart 2: that means last Monday’s 4H dynamic K-line. This upcoming key strength/weakness decision area in the near term: resistance at 795, support at 76. This line moves first up then down—so it’s a fakeout (fakey). In the short term, priority should be given to the expected retest after the trendline breakout.
4. The bull-bear boundary on the daily chart is at 682, and the long/short boundary on the 4H chart is at 755 (recent highs/lows are changing; you can also judge strength/weakness by the 4H cycle around the highs/lows).
Trading view:
1. For spot: building a position at around 6 on the weekly level is the core move for the whole year. After that, you can add more still—but (while not conflicting with the other weekly-based entry zones at 5.2 and 4.5), the key point is that around this 6 area you must not exceed more than three layers of your total position size.
2. Combine the key levels above:
Support: 625 / 68 / 725
Resistance: 795 / 825
In this phase the high is getting lower and the low is also getting lower. So for now, we look for a pullback expectation. As long as the momentum resistance line hasn’t been reclaimed, don’t look bullish. If it breaks out, you can chase a small entry once. After 825, look for opportunities to execute the next leg of the move.
3. For several key support levels, you can wait to trade there. Remember one thing: only use the left-side approach to test with a light position. If 725 breaks, that would be extremely weak—then 68 is likely to be reached.
Hello, good morning everyone (first, let’s find the key levels—our trading view is at the end)
Now everyone should have a question mark in their head ❓
So, is Big Biscuit (BTC) really starting a reversal and moving into the right-side行情?
1. From a weekly perspective: since last October, the decline must be reclaimed and reclaimed strengthfully—standing above 825 is required. This is the signal that the bulls can start a counterattack. Also, the weekly stop-rug/turning zone is farther out: it needs to absorb the 0.618 retracement. Coincidentally, this is also at a resonance point on the channel line.
2. Since the trendline has already formed, is there still room for new lows? This is where technical analysis comes in: only a valid breakout is one where price retests but does not break the level after the trendline is broken. So, to judge whether new lows are still possible: first look whether price can recover the stop-rug/turning level; then look at how the support level moves below.
3. Chart 2: that means last Monday’s 4H dynamic K-line. This upcoming key strength/weakness decision area in the near term: resistance at 795, support at 76. This line moves first up then down—so it’s a fakeout (fakey). In the short term, priority should be given to the expected retest after the trendline breakout.
4. The bull-bear boundary on the daily chart is at 682, and the long/short boundary on the 4H chart is at 755 (recent highs/lows are changing; you can also judge strength/weakness by the 4H cycle around the highs/lows).
Trading view:
1. For spot: building a position at around 6 on the weekly level is the core move for the whole year. After that, you can add more still—but (while not conflicting with the other weekly-based entry zones at 5.2 and 4.5), the key point is that around this 6 area you must not exceed more than three layers of your total position size.
2. Combine the key levels above:
Support: 625 / 68 / 725
Resistance: 795 / 825
In this phase the high is getting lower and the low is also getting lower. So for now, we look for a pullback expectation. As long as the momentum resistance line hasn’t been reclaimed, don’t look bullish. If it breaks out, you can chase a small entry once. After 825, look for opportunities to execute the next leg of the move.
3. For several key support levels, you can wait to trade there. Remember one thing: only use the left-side approach to test with a light position. If 725 breaks, that would be extremely weak—then 68 is likely to be reached.