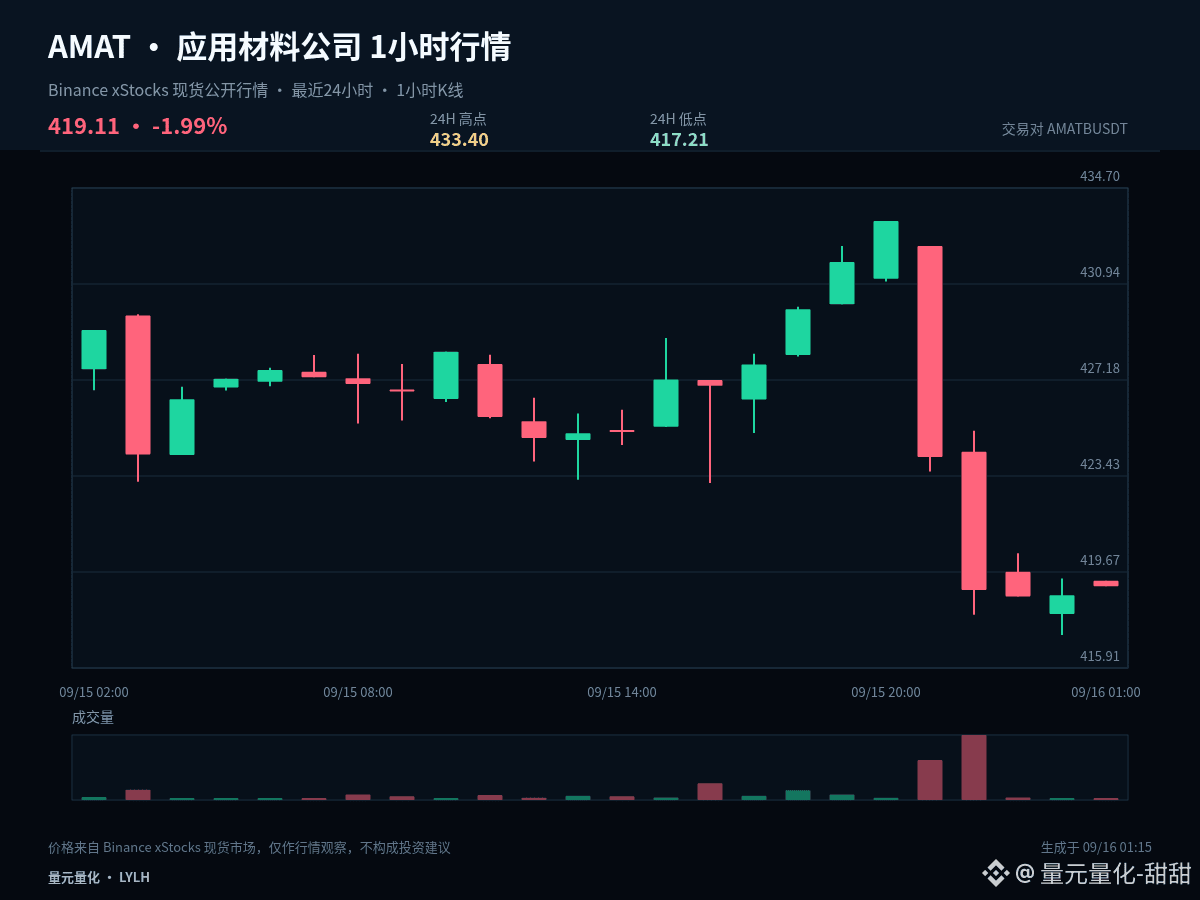
$AMATB #AMAT In a strong trend, pullbacks often reveal the true underlying demand better than accelerated rallies. The current 1-hour change is +0.08%, and the 24-hour change is -2.15%. The key is to judge whether this is a normal cooldown or a sign of weakening structure.
The current price is near the lower end of the past 24 hours' range, with 1-hour +0.08% and 24-hour -2.15%. The core of low-level analysis is not to blindly bottom-fish in advance, but to observe whether price can quickly recover after breaking below support. A quick recovery indicates that selling pressure has been absorbed; remaining below the lower boundary suggests weakness has not yet ended.
Short-term initiative has not been clearly broken. 425.305 is the primary standard for pullback quality. Holding above it and then retesting 433.4 would be considered relatively strong consolidation; if price breaks below the midline and remains there, the focus should shift down to 417.21.
In execution, set clear conditions: after breaking above 433.4, confirmation is needed rather than chasing an instant spike; after dipping to 417.21, watch whether price can quickly reclaim it rather than buying immediately on weakness; when the middle range does not offer enough reward, waiting is also part of the strategy.
Existing positions can be handled in stages according to key levels to avoid making all judgments at once; those without positions should wait for breakout confirmation or a stabilized pullback. For U.S. stock instruments, also pay attention to volatility caused by trading session shifts. The plan should be based on price conditions, not emotions.
A trading plan must include invalidation conditions. If the judgment is correct, profits can be taken in stages; if the judgment is wrong, you must allow yourself to exit. Do not use adding to a position to cover up the fact that the original logic has changed. The market will update, and views should also be adjusted according to price evidence.
#ZamaOpens16ConfidentialMorphoVaults
The current price is near the lower end of the past 24 hours' range, with 1-hour +0.08% and 24-hour -2.15%. The core of low-level analysis is not to blindly bottom-fish in advance, but to observe whether price can quickly recover after breaking below support. A quick recovery indicates that selling pressure has been absorbed; remaining below the lower boundary suggests weakness has not yet ended.
Short-term initiative has not been clearly broken. 425.305 is the primary standard for pullback quality. Holding above it and then retesting 433.4 would be considered relatively strong consolidation; if price breaks below the midline and remains there, the focus should shift down to 417.21.
In execution, set clear conditions: after breaking above 433.4, confirmation is needed rather than chasing an instant spike; after dipping to 417.21, watch whether price can quickly reclaim it rather than buying immediately on weakness; when the middle range does not offer enough reward, waiting is also part of the strategy.
Existing positions can be handled in stages according to key levels to avoid making all judgments at once; those without positions should wait for breakout confirmation or a stabilized pullback. For U.S. stock instruments, also pay attention to volatility caused by trading session shifts. The plan should be based on price conditions, not emotions.
A trading plan must include invalidation conditions. If the judgment is correct, profits can be taken in stages; if the judgment is wrong, you must allow yourself to exit. Do not use adding to a position to cover up the fact that the original logic has changed. The market will update, and views should also be adjusted according to price evidence.
#ZamaOpens16ConfidentialMorphoVaults