
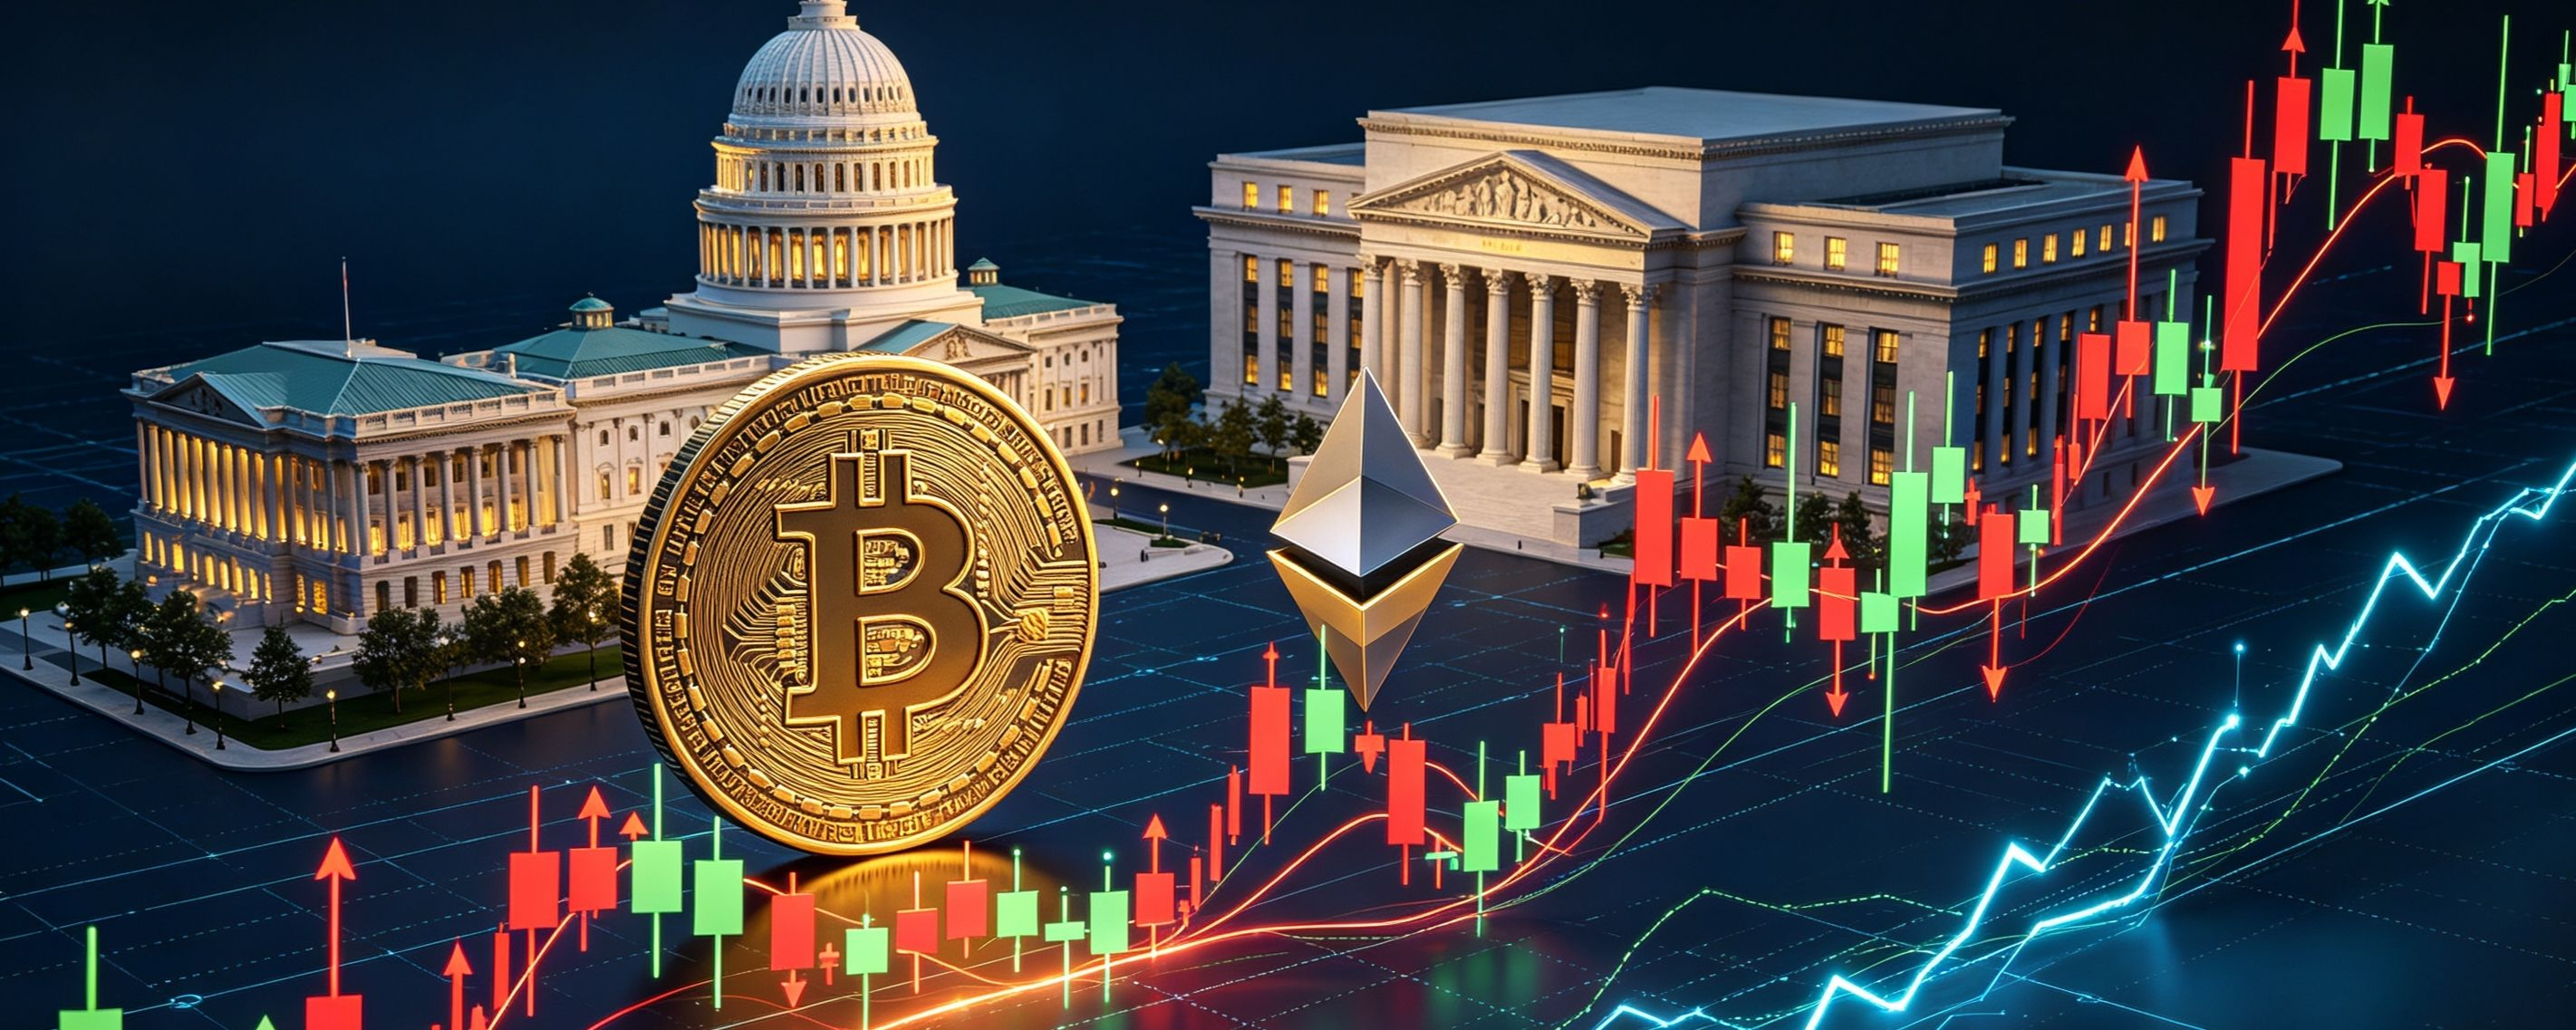

In the U.S., two major key events were launched in succession within 48 hours, directly driving short-term volatility in the crypto market and shaping mid-term expectations. The following outlines the specific timing, details, and trading approach for BTC and ETH.
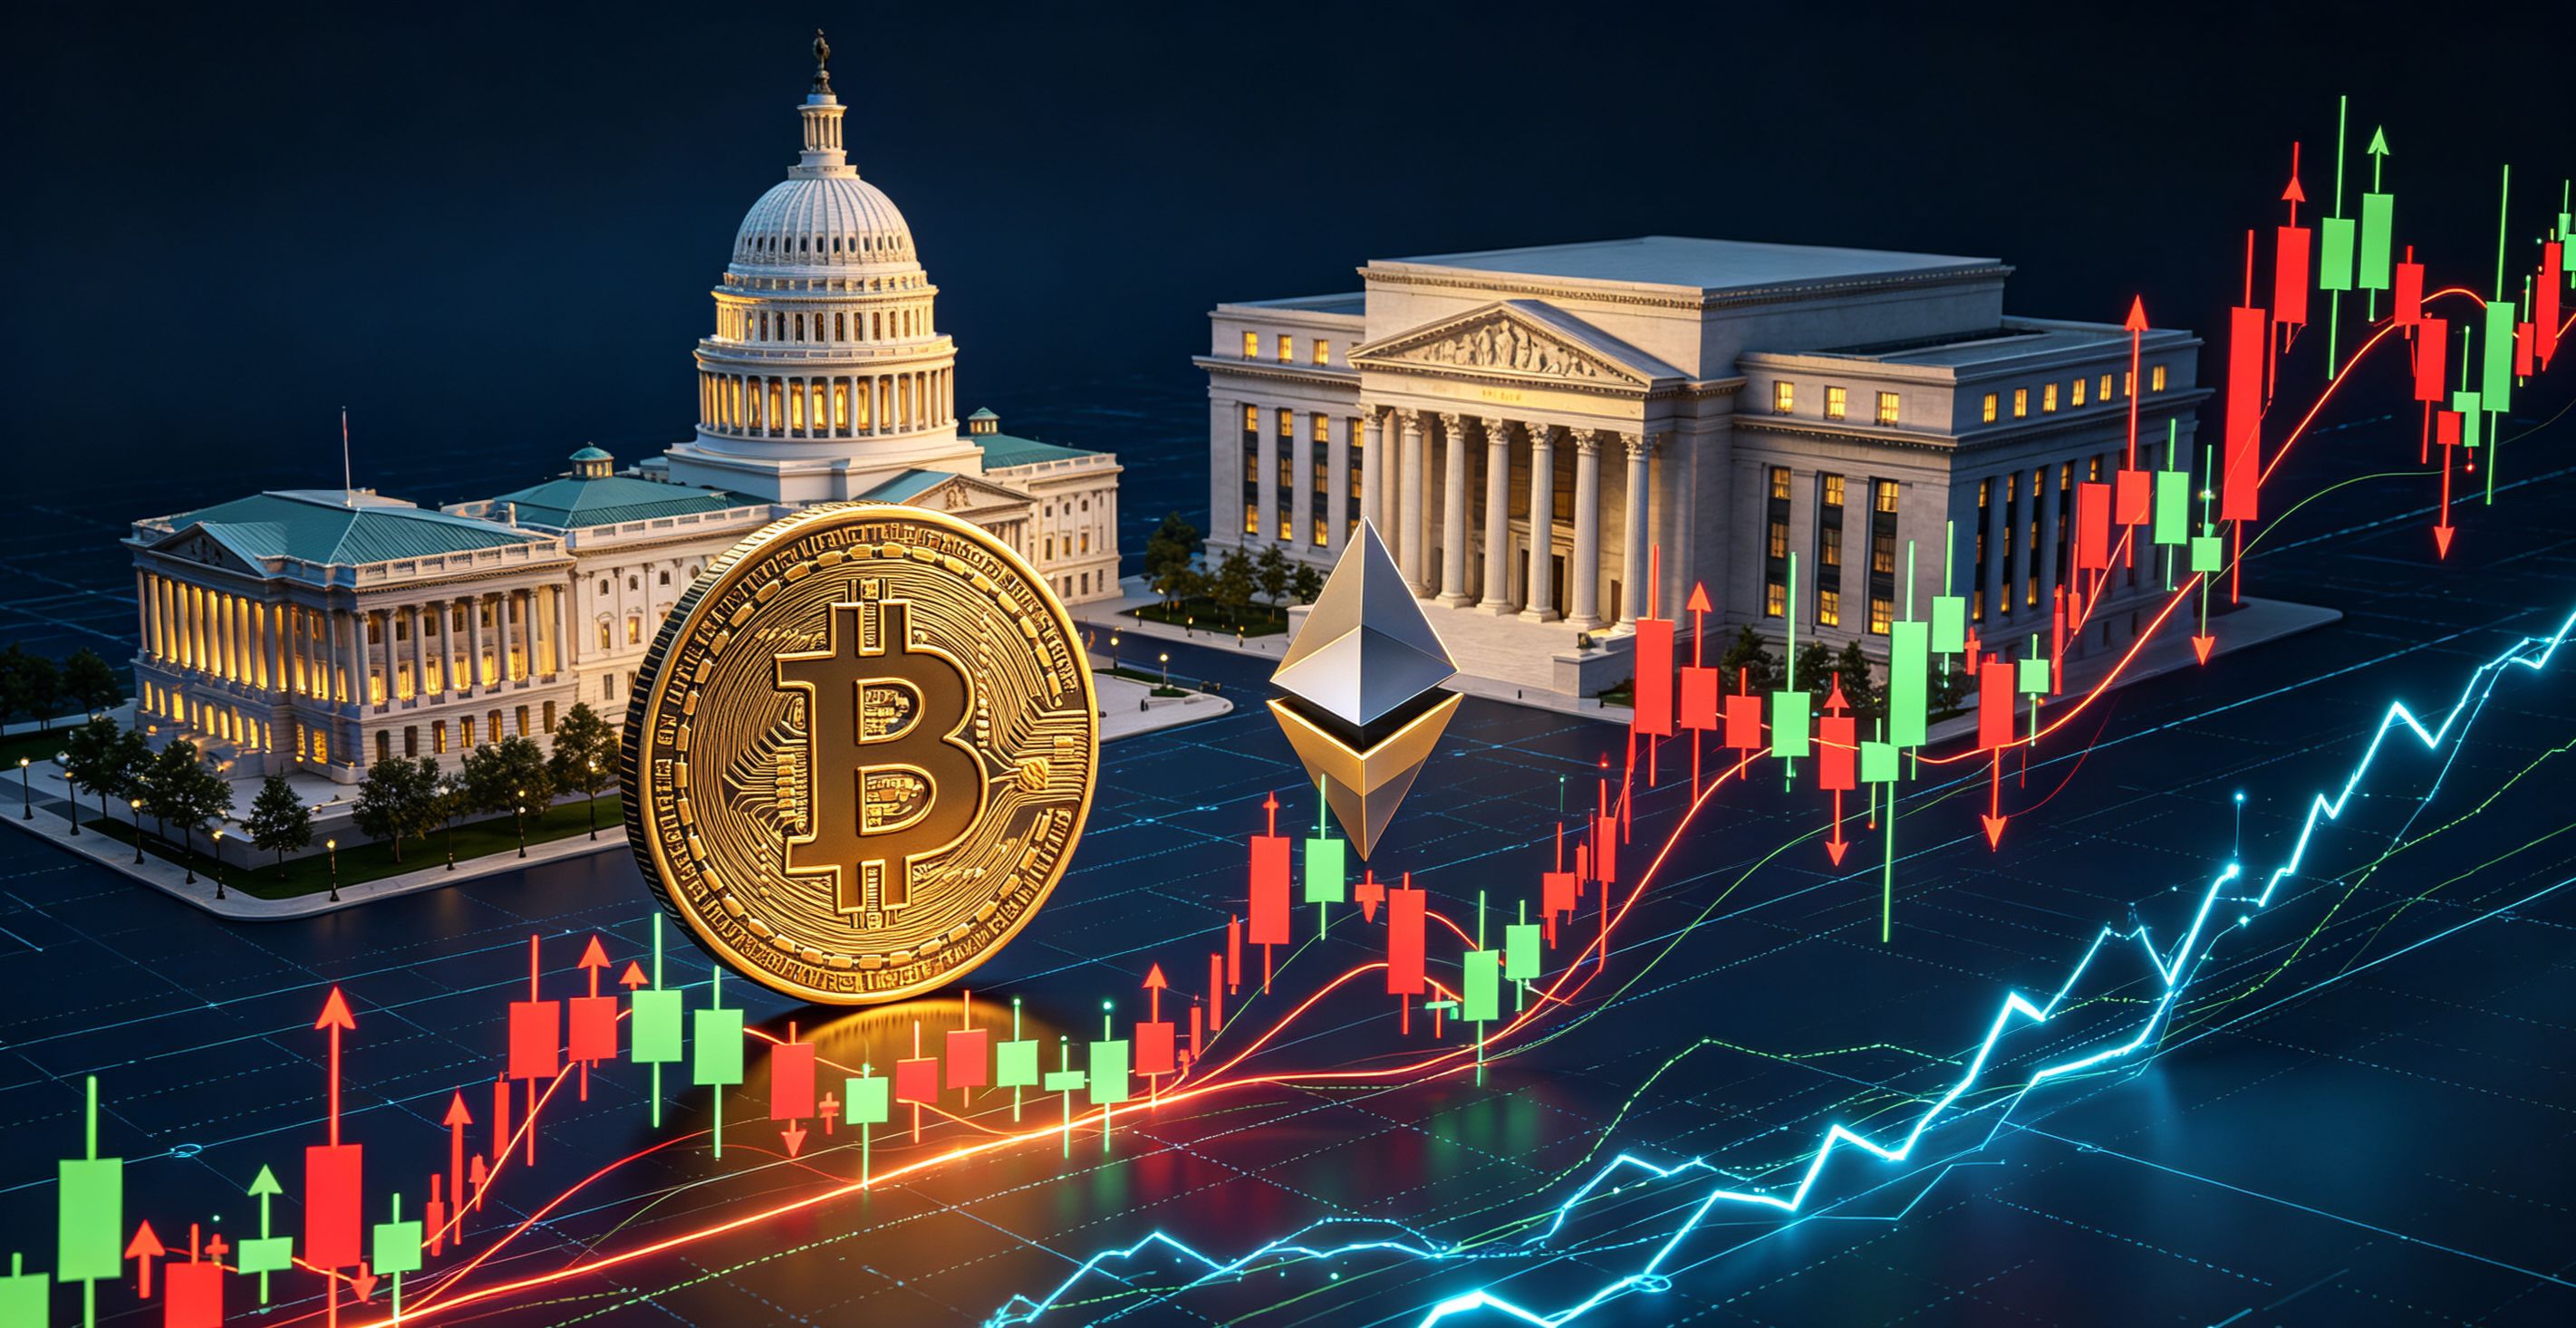
I. Recent U.S. key meetings/events affecting the crypto market
1. Senate CLARITY Act procedural vote
Time: 2:15 PM U.S. Eastern Time on September 15, 2026 (2:15 AM Beijing Time on September 16)
Content: (The Digital Asset Market Clarity Act) (H.R. 3633) cloture motion vote. This is not a final vote on the bill’s passage, but a procedural threshold—60 votes in the Senate are needed to move the bill into formal debate.
The Republicans have 53 seats, so at least 7 Democratic senators must cross party lines to reach the 60-vote threshold.
The bill’s core framework is to draw jurisdictional boundaries between the SEC and CFTC, providing a clear framework for classifying digital assets. The revised 630-page draft incorporates 114 provisions demanded by Democrats, including:
To set up a CFTC-registered category for “non-decentralized” DeFi protocols, define a developer exemption, and include ethical provisions that limit the issuance of digital assets by public officials and their spouses.
Market pricing: Polymarket data shows the probability that the bill will be finally signed into law in 2026 is only 22.5%–29.5%, and the market is pessimistic about its approval in the near term.
2. Federal Reserve FOMC interest-rate decision
Time: September 15 to 16, 2026. The interest-rate decision will be released at 2:00 p.m. Eastern Time on September 16 (2:00 a.m. Beijing time on September 17). After that, the Federal Reserve Chair will deliver remarks.
Content: The current federal funds target range is 3.50%–3.75%.
CME FedWatch shows the probability that the market prices in a 25-basis-point hike to 3.75%–4.00% is about 85%–91%. This would be the Federal Reserve’s first rate hike since July 2023.
The core reason driving expectations for rate hikes to surge sharply is the August inflation data coming in hotter than expected: core CPI rose 0.3% month over month, above the market consensus of 0.2%. At the same time, the situation in the Middle East has pushed up oil prices, which has continued to increase pressure on the supply side.
Federal Reserve Chair Waller’s remarks at the Jackson Hole symposium were relatively hawkish. He emphasized, “We must be confident that the level of underlying inflation is clearly moving toward the goal—or else there’s still work to do.”
Special background: This is the first time for the current Federal Reserve Chair, Kevin Warsh, to face a decision on whether to raise rates. Also, at the July meeting, three regional Fed presidents dissented and supported a rate hike—signals of a policy shift are relatively strong.
3. Other related events
· Solana Summit: Washington x Wall Street (September 14):
SEC Chair Paul Atkins delivered a closing keynote speech. SEC Commissioner “Crypto Mom” Hester Peirce participated in a fireside chat. Congressman Tom Emmer and Senator Cynthia Lummis confirmed their attendance.
· Trump White House Crypto Summit (August 19):
It was held earlier; attendees included corporate executives such as Coinbase, Ripple, and a16z. Trump positioned Bitcoin as an “anti-inflation hedging tool.”
II. Analysis of the future direction of the crypto market
Short term (the next 1–2 weeks)
Volatility will be significantly amplified.
Two binary risk events landed back-to-back within 48 hours, and current implied volatility is low. The CEO of options market maker STS Digital clearly stated, “Low-volatility conditions probably won’t last.”
The market is showing contradictory signals: crypto assets were generally stronger before the event (BTC around $79,164, ETH around $2,541), XRP surged 7.7% in a single day—contrasting sharply with weakness in traditional equities and gold prices.
But at the same time, Bitcoin spot ETFs saw net outflows for four consecutive trading days, totaling about $463 million. Meanwhile, Ethereum spot ETFs recorded net inflows of about $197 million—institutional capital’s willingness to allocate to ETH is clearly stronger than for BTC.
Medium term (the next 1–3 months)
If the CLARITY bill’s procedural vote fails, given the tight schedule before the midterm elections, it is very unlikely that an additional attempt will be made before the end of the 119th Congress. Regulation would revert to a “regulation by enforcement instead of regulation” state, and ongoing uncertainty would suppress institutions’ entry timing.
If the vote succeeds, it would mean the legislative pathway is reopened, warming expectations for clearer regulation.
If the Federal Reserve’s rate hike is implemented, higher front-end interest rates will raise the discount rate for non-yielding assets and support the U.S. dollar. Historically, this tends to compress risk appetite for digital assets.
However, Grayscale research director Zach Pandl believes that any pullback is likely to be limited and may provide an opportunity to enter for investors who might otherwise miss the August rally.
Medium to long term (6–12 months)
Fundstrat co-founder Tom Lee said the market’s excessive leverage continues to clear, and the four-year cycle low is nearing. Crypto still has a strong chance to maintain momentum over the next 12 months.
He is especially bullish on two structural drivers: large financial institutions pushing forward tokenization initiatives on Ethereum, and the expansion of AI capabilities driving increased demand for blockchain infrastructure—he believes AI agents in the future may view crypto infrastructure as a more suitable underlying operating environment than traditional finance.
The (2026 Digital Asset Trends White Paper) released by HTX provides its assessment from an asset positioning perspective:
Bitcoin has been deeply embedded in global asset allocation models from an “edge innovation experiment,” and price-making power is further shifting toward long-term capital. With its mature staking and DeFi infrastructure, Ethereum has established the position of “on-chain treasuries,” becoming a cash-flow-driven growth asset.
III. Trading ideas and strategies for Bitcoin and Ethereum
Bitcoin (BTC)
Recent key price levels:
Direction Price Explanation
Key support① $76,500–$77,000 The core support zone that has been tested and held up multiple times recently
Key support② $74,000–$75,000 Deeper layer support; a break below would turn bearish.
Key resistance① $79,000–$80,000 The first hurdle that needs to be broken for near-term upside
Key resistance② $81,700–$82,000 The bull-market confirmation level emphasized by CryptoQuant
Recent strategy: The core idea is “buy long at low levels, don’t chase highs.”
As long as BTC does not effectively break below $75,000, the bullish structure remains intact. On pullbacks into the $77,000–$76,000 range, you can stage entries for long positions. If price rises into the $78,000–$80,000 range, you should proactively reduce positions and lock in profits rather than chasing the rally.
What to watch out for is that BTC is still below the 50-week moving average. There is a dense cluster of resistance overhead. If the weekly close cannot regain that moving average, the medium-term trend may weaken.
Medium- to long-term strategy: Maintain a spot DCA (dollar-cost averaging) approach, and keep leverage low during pullbacks—this is the most稳妥 way to protect capital amid volatility.
Glassnode on-chain data shows that roughly 1.07 million BTC has been concentrated and settled in the $83,000–$86,000 range—almost all bought by long-term holders over the past half year. This range is a key dense supply/resistance area that should be重点ly watched in the medium and long term.
VanEck’s 2026 outlook suggests Bitcoin may enter a consolidation phase. The potential pullback could shrink from 80% in the prior cycle to 40%. It recommends building positions using a dollar-cost-averaging approach, with a focus on the risk-reward ratio.
Ethereum (ETH)
Recent key price levels:
Direction Price Explanation
Key support① $2,480–$2,500 A short-term lifeline and a core level that has repeatedly been tested and where price has stabilized
Key support② $2,350–$2,400 Maintaining the key support for the uptrend in the third quarter
Key resistance① $2,550–$2,565 The decisive level where the 50-week moving average and weekly resistance overlap
Key resistance② $2,600–$2,670 After a breakout, it opens up space toward $3,000
Recent strategy:
The key for ETH is whether it can close the weekly chart above $2,550. This level overlaps with the 50-week moving average and will determine whether the 60.62% rally in the third quarter extends toward $3,000 or pulls back to $2,400.
In terms of trading, consider lightly going long near $2,500 and $2,450. For resistance levels, $2,550, $2,600, and $2,650 should be watched sequentially; it is not advisable to chase longs after a breakout. When the market rallies sharply, take profit and reduce positions at high levels; when it drops sharply, decisively add back near key support.
Medium- to long-term strategy:
Ethereum shows a clear advantage on the institutional demand side relative to Bitcoin: spot ETH ETFs have seen positive fund inflows for four straight weeks, while BTC ETFs have continued to see outflows over the same period. This divergence is worth paying attention to.
Standard Chartered Bank compares Ethereum to Amazon in 2001, maintaining a target price of $4,000 by the end of 2026 and a long-term target of $40,000 by 2030. The key logic is ETH’s dominant position in stablecoins and RWA (real-world assets) (accounting for 54% of the stablecoin market share).
Fundstrat’s Tom Lee is even more aggressive. He believes ETH could easily break above $10,000 in the next one to two years, and his company has executed a weekly ETH buying strategy for more than 60 consecutive weeks.
Tom Lee also reminds investors that they don’t need to be fixated on perfectly timing the bottom. Buying in the first four weeks before market lows, or entering one week after the low appears, could both fall within relatively attractive ranges. If you wait only for “confirmation that the bottom is in,” you may miss most of the upside.
Returns from cryptocurrencies often concentrate in just a handful of strong trading days, and as of 2026 so far, such explosive rallies have hardly appeared. There is still room for upside before year-end.
Risk disclaimer: The analysis above is based on consolidated public market data and institutional viewpoints and does not constitute investment advice.
Crypto assets are highly volatile, and there is uncertainty both in the CLARITY bill vote outcome and the Federal Reserve’s interest-rate decision. Make independent decisions based on your own risk tolerance.