$BTC Liying Talks Coin: 9.15 Latest Market Analysis of Bitcoin (BTC) and Ethereum (ETH)
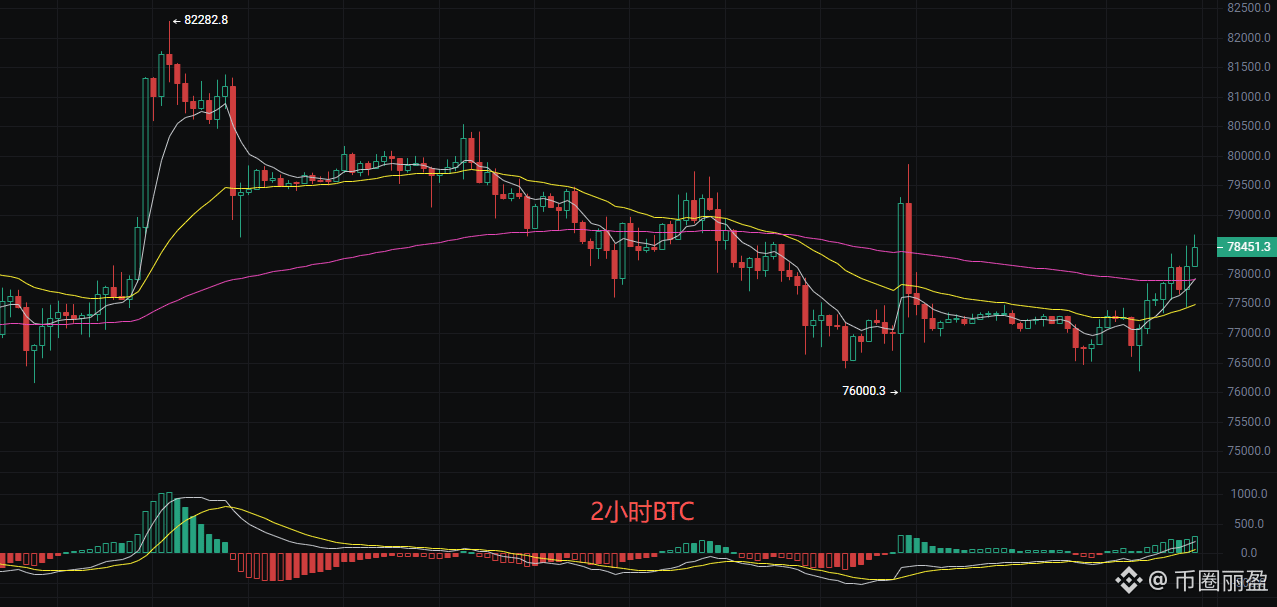
Dear family members! Bitcoin’s current price is 78,450. This move looks pretty interesting. After pulling back all the way from the 82,000 high, it was hammered down to around 76,000. In the past few days, it has been slowly climbing back. Now the price is sitting on the middle band of the Bollinger Bands, and the short-term moving averages have started to turn upward as well—feeling like it can’t fall any further and may bounce. However, there’s also considerable resistance overhead, since many trapped positions are still above. Whether it can break through depends on whether the trading volume can keep up. After the MACD indicator’s DIF and DEA formed a golden cross below the zero axis, they continued to diverge upward, accumulating bullish strength. After the Bollinger Bands tightened, the price broke above the middle band at 77,360. The upper band resistance is at 78,264. The current price has already touched the upper band. If it can hold effectively, it will open up upside room; otherwise, it may pull back to the middle band to confirm support.
Short-term trade ideas (reference):
Go long at 76,500, defense at 76,000, stop-loss 400 points, target 77,000, aiming for 78,500
Go short at 79,500, defense at 80,000, stop-loss 400 points, target 78,500, aiming for 78,000
Ethereum
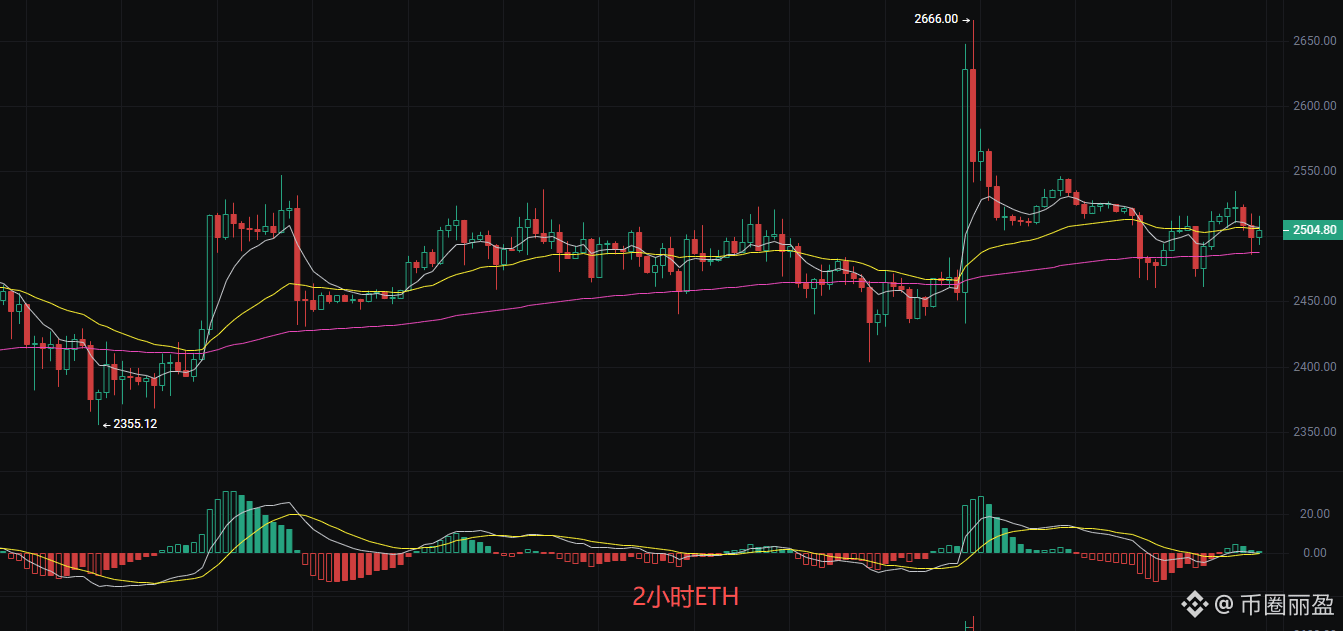
Dear family members! Ethereum’s current price is 2,500. Many people are rushing to chase and then get beaten from both sides. Actually, this is a classic “pressure above, support below” squeeze-market. The main force is washing the market, shaking out the uncommitted. The technical indicators show a typical rise-then-retrace and consolidation structure. In the EMA moving average system, EMA7 and EMA30 are sticking together around 2,500, indicating that short-term costs are converging and a direction decision is imminent. In the MACD indicator, bearish momentum (DIF and DEA) is exhausting, while bullish power is building. The Bollinger Bands’ middle band forms a key resistance level; if the price can break through and hold above the middle band effectively, it will open upside room toward the 2,580–2,600 zone. If it continues to come under pressure, it may pull back toward the lower band around 2,472 to seek support. Overall, the market is in a wait-for-launch phase; you need to wait for a clear breakout signal to confirm the direction.
Short-term price level references
Go long at 2,460, defense at 2,420, stop-loss 40 points, target 2,520, aiming for 2,560
Go short at 2,550, defense at 2,600, stop-loss 40 points, target 2,500, aiming for 2,460
The above content is an exclusive original by Liying. If you转载, please indicate the source! There is a delay in the article publication review. Markets change rapidly; the above suggestions are for reference only—risk is your own responsibility.
#BTC走势分析
Dear family members! Bitcoin’s current price is 78,450. This move looks pretty interesting. After pulling back all the way from the 82,000 high, it was hammered down to around 76,000. In the past few days, it has been slowly climbing back. Now the price is sitting on the middle band of the Bollinger Bands, and the short-term moving averages have started to turn upward as well—feeling like it can’t fall any further and may bounce. However, there’s also considerable resistance overhead, since many trapped positions are still above. Whether it can break through depends on whether the trading volume can keep up. After the MACD indicator’s DIF and DEA formed a golden cross below the zero axis, they continued to diverge upward, accumulating bullish strength. After the Bollinger Bands tightened, the price broke above the middle band at 77,360. The upper band resistance is at 78,264. The current price has already touched the upper band. If it can hold effectively, it will open up upside room; otherwise, it may pull back to the middle band to confirm support.
Short-term trade ideas (reference):
Go long at 76,500, defense at 76,000, stop-loss 400 points, target 77,000, aiming for 78,500
Go short at 79,500, defense at 80,000, stop-loss 400 points, target 78,500, aiming for 78,000
Ethereum
Dear family members! Ethereum’s current price is 2,500. Many people are rushing to chase and then get beaten from both sides. Actually, this is a classic “pressure above, support below” squeeze-market. The main force is washing the market, shaking out the uncommitted. The technical indicators show a typical rise-then-retrace and consolidation structure. In the EMA moving average system, EMA7 and EMA30 are sticking together around 2,500, indicating that short-term costs are converging and a direction decision is imminent. In the MACD indicator, bearish momentum (DIF and DEA) is exhausting, while bullish power is building. The Bollinger Bands’ middle band forms a key resistance level; if the price can break through and hold above the middle band effectively, it will open upside room toward the 2,580–2,600 zone. If it continues to come under pressure, it may pull back toward the lower band around 2,472 to seek support. Overall, the market is in a wait-for-launch phase; you need to wait for a clear breakout signal to confirm the direction.
Short-term price level references
Go long at 2,460, defense at 2,420, stop-loss 40 points, target 2,520, aiming for 2,560
Go short at 2,550, defense at 2,600, stop-loss 40 points, target 2,500, aiming for 2,460
The above content is an exclusive original by Liying. If you转载, please indicate the source! There is a delay in the article publication review. Markets change rapidly; the above suggestions are for reference only—risk is your own responsibility.
#BTC走势分析