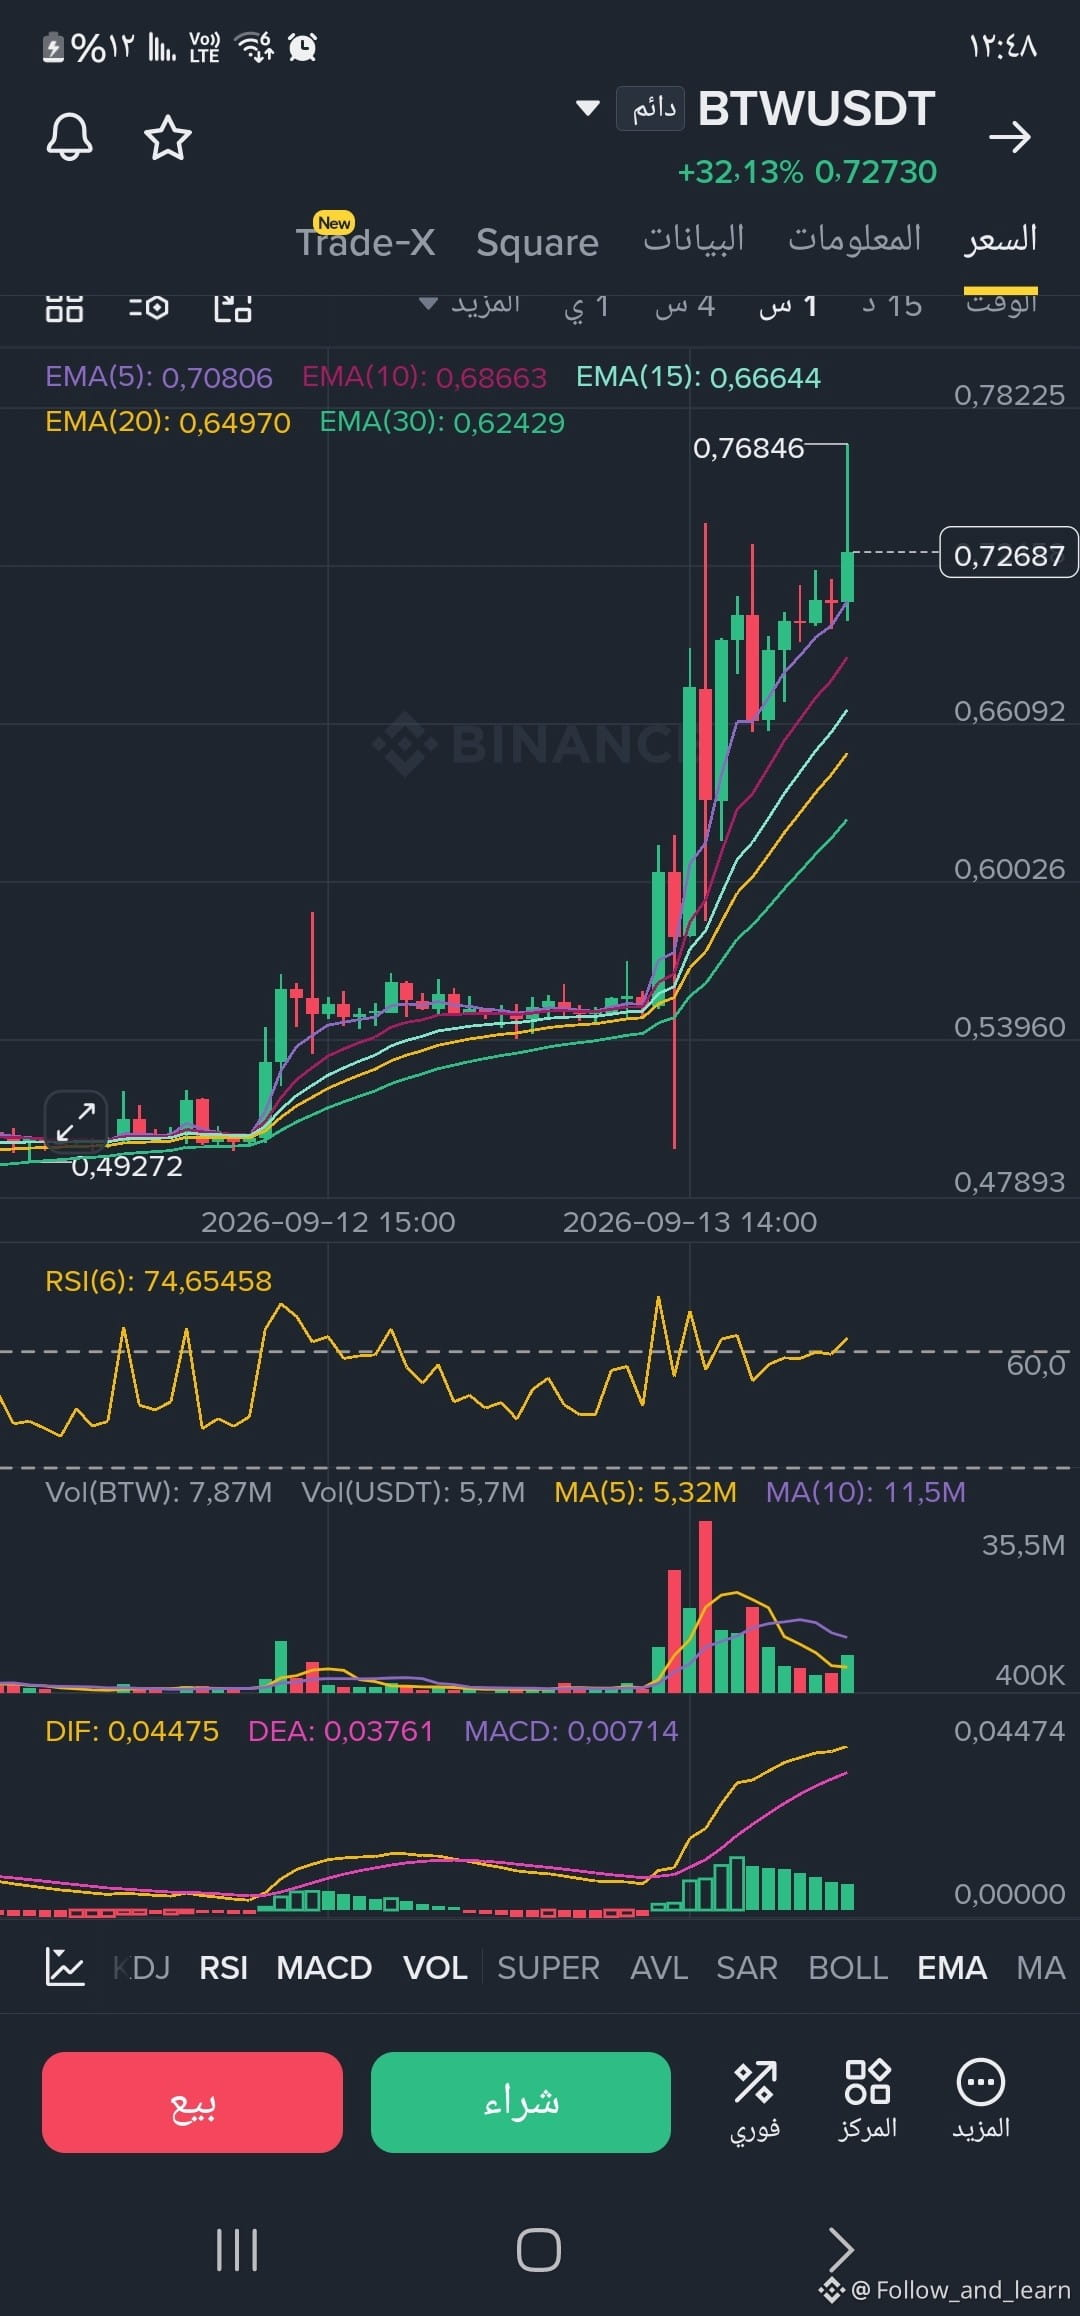
Hello everyone. As someone who has been trading in these markets, I know exactly what goes through your mind when you see a green candle and a percentage exceeding +32%… Your mind whispers: "Hurry up and enter before the train leaves!"
"The beginner buys at the top out of fear of missing out (FOMO), while the professional waits for the calm after the storm to seize the opportunity."
1️⃣ Overall trend: strongly bullish, with clear dominance from buyers.
2️⃣ Indicators:
* Moving Averages (EMA): Perfect positive alignment for all moving averages (EMA 5 > EMA 10 > EMA 20). The price is moving in harmony above the EMA5 ($0.708).
* Relative Strength Index (RSI 6): Reading at 74.65, which is in the overbought zone. This reflects strong momentum, but it also reminds us that the price may need a pause or a small correction before continuing the path.
* MACD Indicator: Still providing a positive signal in the green zone.
🎯 Levels for the next move:
* Resistance levels (next targets): $0.768, then $0.782 (the recent high).
* Support zones (safety areas): $0.708 (EMA5), followed by the $0.686 zone (EMA10).
🛡️ Tip
* Don’t chase the green candle: Entering directly now after a 32% jump involves high risk with an unworthy reward-to-risk ratio.
* Wait for the best scenario: Look for entry opportunities on a retest of the nearby support areas ($0.708 - $0.686) and confirmation that the price holds above them.
* Risk management is the secret to staying in the game: Don’t enter with more than you can afford to lose #BTW $BTW
"The beginner buys at the top out of fear of missing out (FOMO), while the professional waits for the calm after the storm to seize the opportunity."
1️⃣ Overall trend: strongly bullish, with clear dominance from buyers.
2️⃣ Indicators:
* Moving Averages (EMA): Perfect positive alignment for all moving averages (EMA 5 > EMA 10 > EMA 20). The price is moving in harmony above the EMA5 ($0.708).
* Relative Strength Index (RSI 6): Reading at 74.65, which is in the overbought zone. This reflects strong momentum, but it also reminds us that the price may need a pause or a small correction before continuing the path.
* MACD Indicator: Still providing a positive signal in the green zone.
🎯 Levels for the next move:
* Resistance levels (next targets): $0.768, then $0.782 (the recent high).
* Support zones (safety areas): $0.708 (EMA5), followed by the $0.686 zone (EMA10).
🛡️ Tip
* Don’t chase the green candle: Entering directly now after a 32% jump involves high risk with an unworthy reward-to-risk ratio.
* Wait for the best scenario: Look for entry opportunities on a retest of the nearby support areas ($0.708 - $0.686) and confirmation that the price holds above them.
* Risk management is the secret to staying in the game: Don’t enter with more than you can afford to lose #BTW $BTW