

Dmzsasa UID 373815371
75 Posts

Dmzsasa UID 373815371
Report
Block User
6.5K+ Following
1.0K+ Followers
300 Liked
Posts
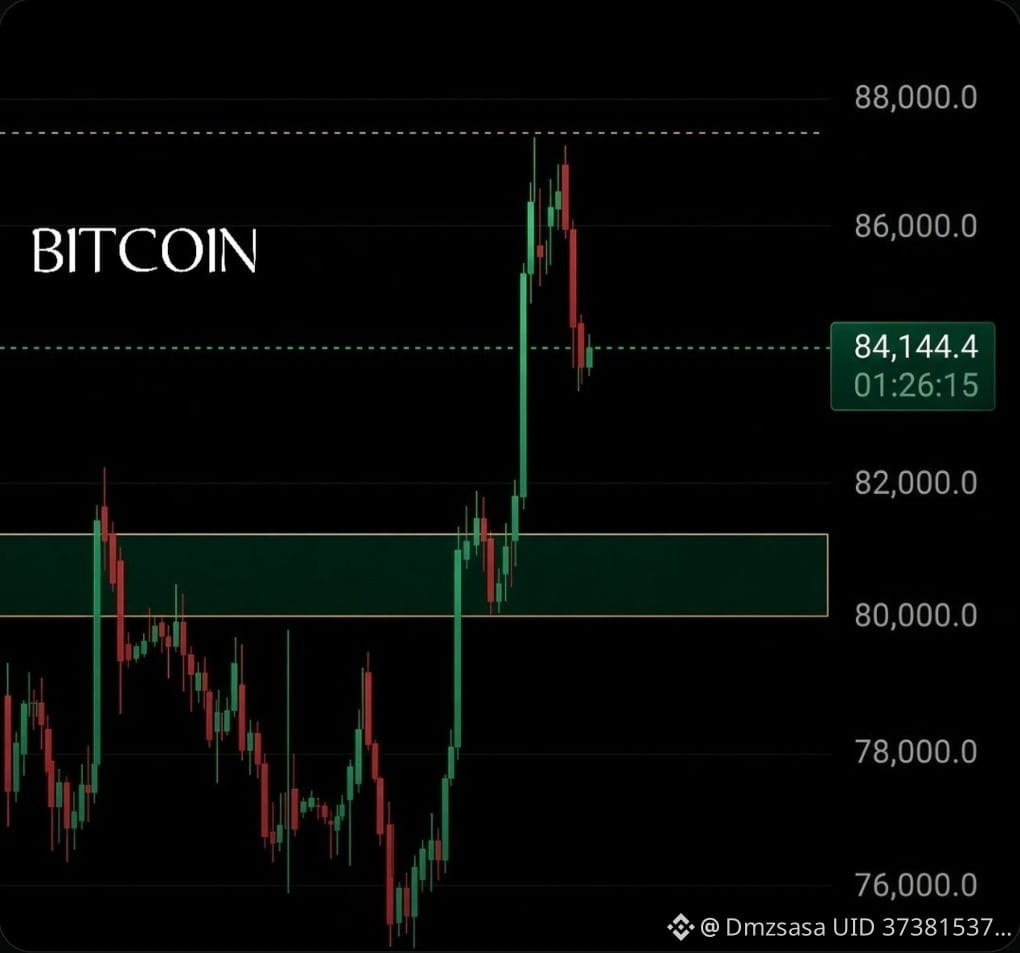
While BTC stays above $80,000 and even with elevated risk remains above $78,000, there’s no need to panic.
Let’s calmly scalp. ✊
If a crash happens, then we’ll deal with it.
{future}(BTCUSDT)
$BTC
While BTC stays above $80,000 and even with elevated risk remains above $78,000, there’s no need to panic.
Let’s calmly scalp. ✊
If a crash happens, then we’ll deal with it.
$BTC
Let’s calmly scalp. ✊
If a crash happens, then we’ll deal with it.
$BTC
106
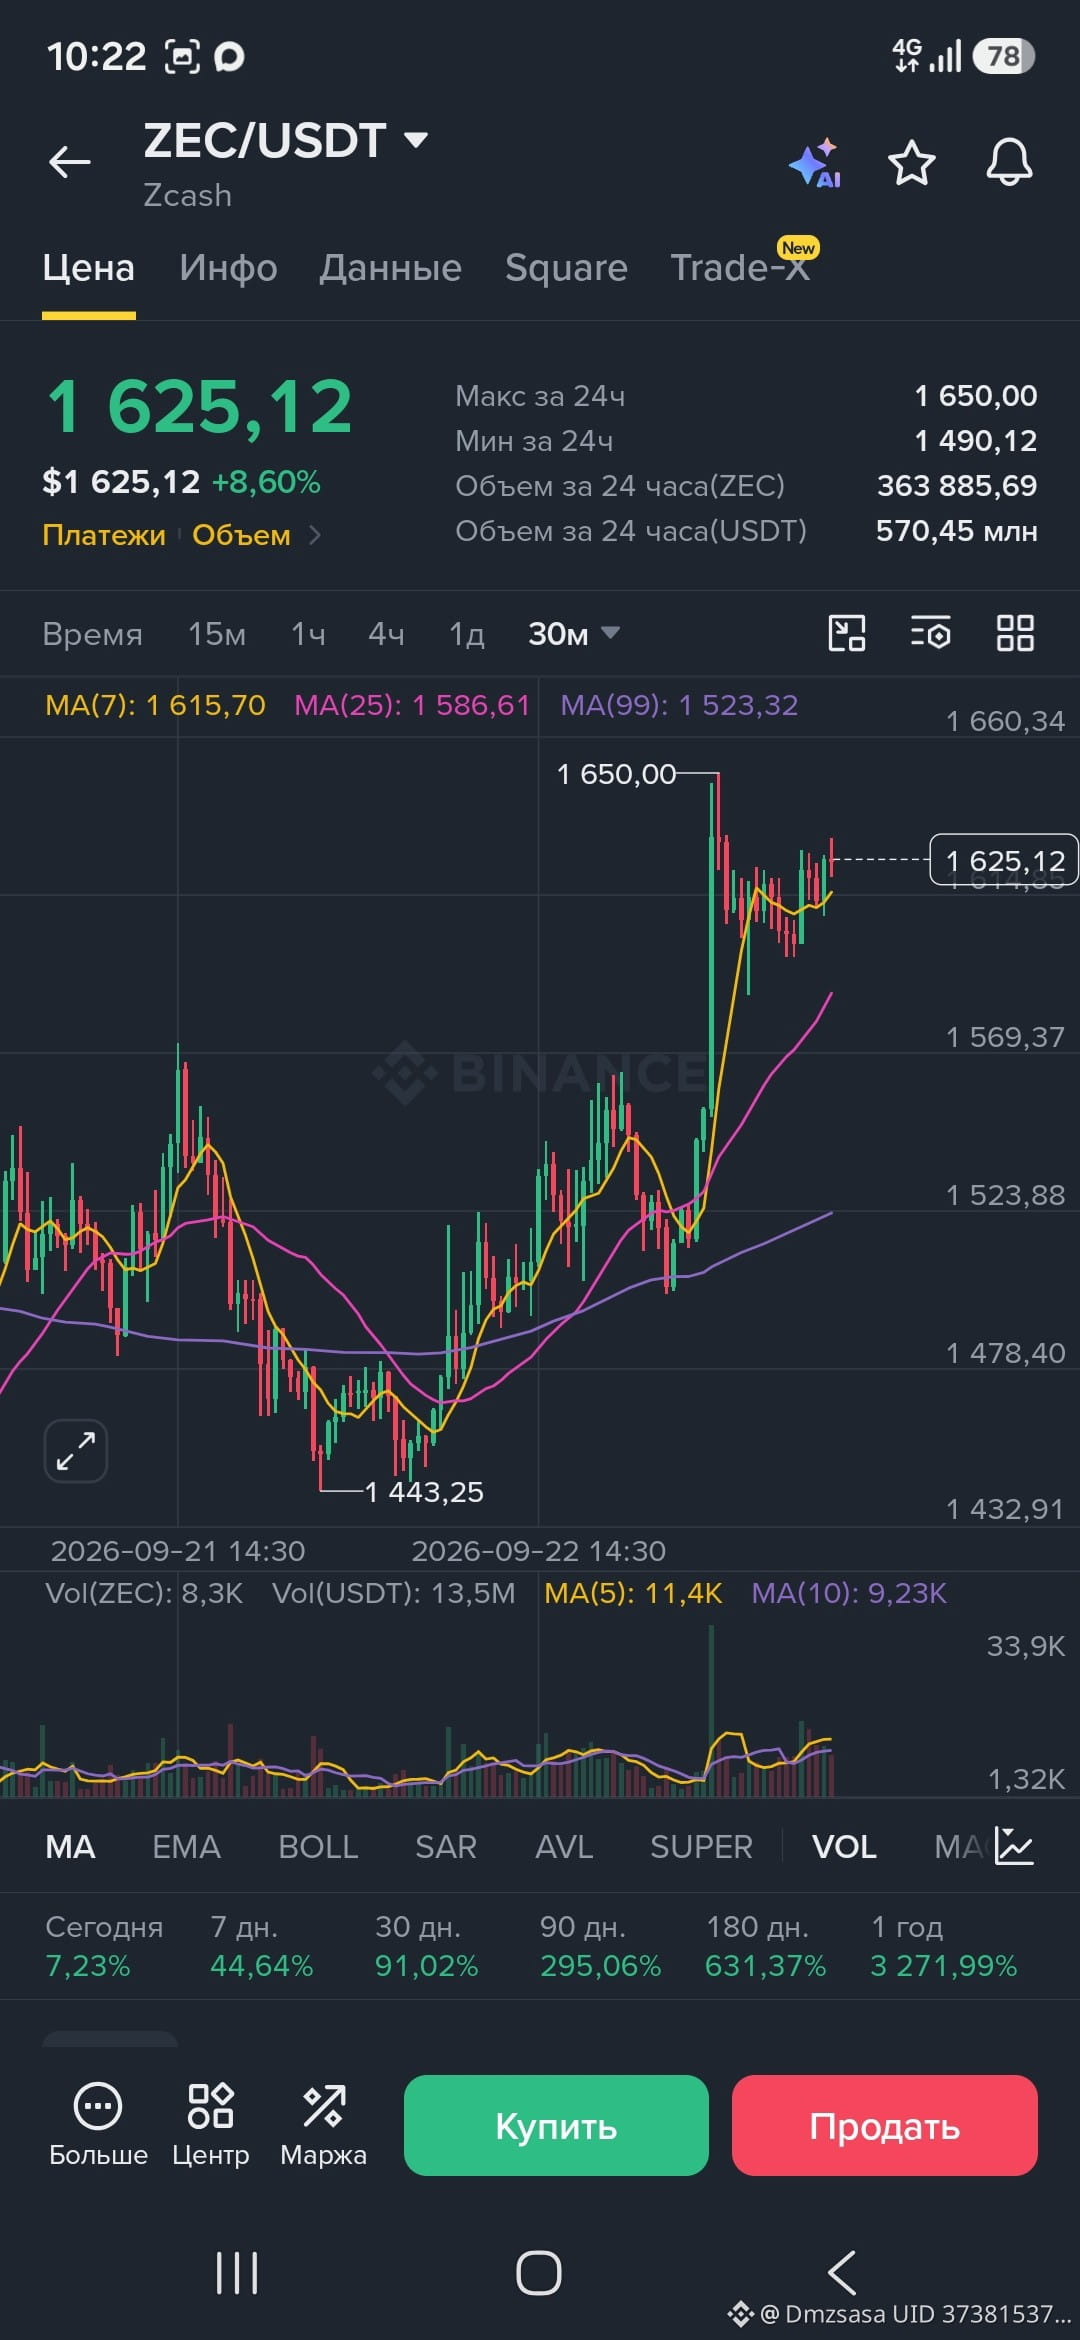
$ZEC — buy or sell? Analysis for 30m
Zcash issued a strong impulse: from 1,443.25 to 1,650.00. Now the price is 1,625.12, daily growth +8.60%. The question is simple: enter long or lock in profit?
What the 30m chart says:
• MA(7) = 1,615.70 — price is above the fast moving average. Locally bullish signal.
• MA(25) = 1,586.61 — the second support is lower. As long as we stay above it, buyers are in control.
• MA(99) = 1,523.32 — long-term support. Below it, the scenario breaks.
• Volume: 570.45M USDT over 24h, the spike happened during the impulse. Right now, volumes are falling—sign of waning momentum.
My verdict: buying now is risky.
Reason: the price is already at the peak, volumes are declining, and the 30m timeframe tends toward sharp pullbacks. Entering at 1,625 means buying at the maximum.
What to do:
• Wait for a pullback to 1,586–1,569—then look for a long with a target of 1,650+.
• Selling makes sense only if the price breaks below 1,569 with volume. Then the target is 1,523.
• Stop for the long: below 1,523 (MA99).
Statistics: over 30 days +91%, over the year +3,271%. The coin is strongly overheated on higher timeframes—another reason not to buy at the highs.
Bottom line: I’m waiting for a pullback, then I buy. For now—I’m just watching.
Are you already in a position with ZEC, or are you only monitoring? $ZEC #Zcash #crypto #трейдинг
{future}(ZECUSDT)
$ZEC
$ZEC — buy or sell? Analysis for 30m
Zcash issued a strong impulse: from 1,443.25 to 1,650.00. Now the price is 1,625.12, daily growth +8.60%. The question is simple: enter long or lock in profit?
What the 30m chart says:
• MA(7) = 1,615.70 — price is above the fast moving average. Locally bullish signal.
• MA(25) = 1,586.61 — the second support is lower. As long as we stay above it, buyers are in control.
• MA(99) = 1,523.32 — long-term support. Below it, the scenario breaks.
• Volume: 570.45M USDT over 24h, the spike happened during the impulse. Right now, volumes are falling—sign of waning momentum.
My verdict: buying now is risky.
Reason: the price is already at the peak, volumes are declining, and the 30m timeframe tends toward sharp pullbacks. Entering at 1,625 means buying at the maximum.
What to do:
• Wait for a pullback to 1,586–1,569—then look for a long with a target of 1,650+.
• Selling makes sense only if the price breaks below 1,569 with volume. Then the target is 1,523.
• Stop for the long: below 1,523 (MA99).
Statistics: over 30 days +91%, over the year +3,271%. The coin is strongly overheated on higher timeframes—another reason not to buy at the highs.
Bottom line: I’m waiting for a pullback, then I buy. For now—I’m just watching.
Are you already in a position with ZEC, or are you only monitoring? $ZEC #Zcash #crypto #трейдинг
$ZEC
Zcash issued a strong impulse: from 1,443.25 to 1,650.00. Now the price is 1,625.12, daily growth +8.60%. The question is simple: enter long or lock in profit?
What the 30m chart says:
• MA(7) = 1,615.70 — price is above the fast moving average. Locally bullish signal.
• MA(25) = 1,586.61 — the second support is lower. As long as we stay above it, buyers are in control.
• MA(99) = 1,523.32 — long-term support. Below it, the scenario breaks.
• Volume: 570.45M USDT over 24h, the spike happened during the impulse. Right now, volumes are falling—sign of waning momentum.
My verdict: buying now is risky.
Reason: the price is already at the peak, volumes are declining, and the 30m timeframe tends toward sharp pullbacks. Entering at 1,625 means buying at the maximum.
What to do:
• Wait for a pullback to 1,586–1,569—then look for a long with a target of 1,650+.
• Selling makes sense only if the price breaks below 1,569 with volume. Then the target is 1,523.
• Stop for the long: below 1,523 (MA99).
Statistics: over 30 days +91%, over the year +3,271%. The coin is strongly overheated on higher timeframes—another reason not to buy at the highs.
Bottom line: I’m waiting for a pullback, then I buy. For now—I’m just watching.
Are you already in a position with ZEC, or are you only monitoring? $ZEC #Zcash #crypto #трейдинг
$ZEC
79
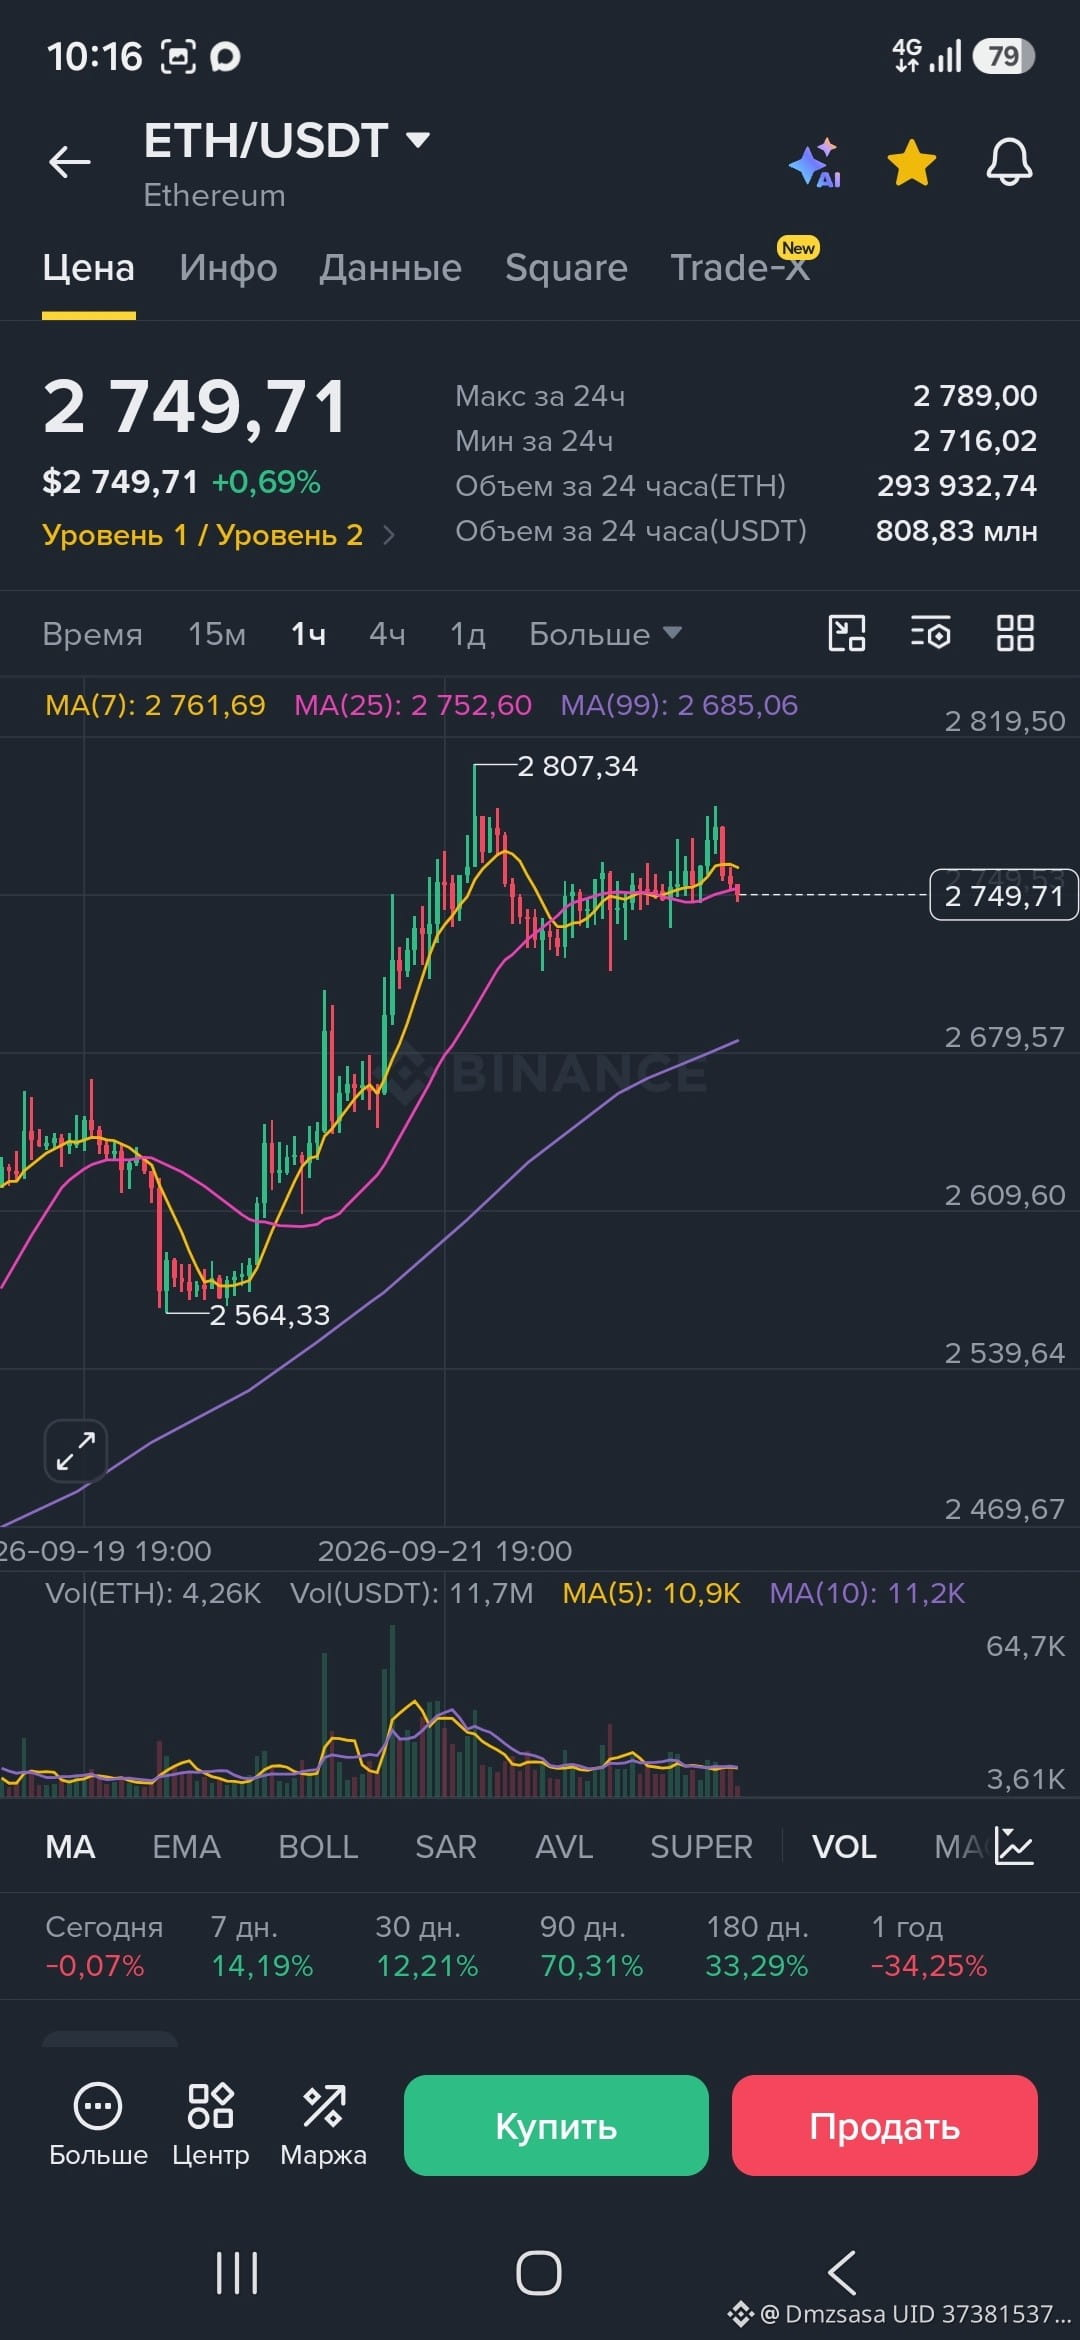
$ETH — The hourly chart shows compression. What’s next?
I’m looking at ETH/USDT on the 1-hour timeframe. After bouncing off 2,564.33, the price moved into a tight range and is now trading around 2,749.71, with a 24-hour change of just +0.69%.
What we see on the hour:
• MA(7) = 2,761.69 and MA(25) = 2,752.60 — the lines are almost stuck together. This is a sign of volatility compression, which is usually followed by an impulse.
• MA(99) = 2,685.06 — the long-term average is lower and rising. This is support in case of a deeper pullback.
• Volumes: 808.83M USDT over 24h, but on the hourly candles activity seems to be fading — the market is building a position.
Key levels on the hour:
• Resistance: 2,789 (24h high), then 2,807.34 (local peak).
• Support: 2,716.02 (24h low); below that is 2,679 (MA99 zone).
My plan:
• Break above 2,789 with rising volume → target 2,807, then 2,850+.
• Lose 2,716 → I’ll wait for a test of 2,679, and then watch the reaction there.
Coin stats: over 90 days +70.31%, over a year -34.25%. This looks like a recovery phase, and the current pause seems more like accumulation than a reversal.
Personally, I’m waiting for confirmation at 2,789. I won’t enter without volume.
How do you read the ETH hourly chart — up, or is there still more downside? $ETH #Ethereum #crypto #трейдинг
{future}(ETHUSDT)
$ETH
$ETH — The hourly chart shows compression. What’s next?
I’m looking at ETH/USDT on the 1-hour timeframe. After bouncing off 2,564.33, the price moved into a tight range and is now trading around 2,749.71, with a 24-hour change of just +0.69%.
What we see on the hour:
• MA(7) = 2,761.69 and MA(25) = 2,752.60 — the lines are almost stuck together. This is a sign of volatility compression, which is usually followed by an impulse.
• MA(99) = 2,685.06 — the long-term average is lower and rising. This is support in case of a deeper pullback.
• Volumes: 808.83M USDT over 24h, but on the hourly candles activity seems to be fading — the market is building a position.
Key levels on the hour:
• Resistance: 2,789 (24h high), then 2,807.34 (local peak).
• Support: 2,716.02 (24h low); below that is 2,679 (MA99 zone).
My plan:
• Break above 2,789 with rising volume → target 2,807, then 2,850+.
• Lose 2,716 → I’ll wait for a test of 2,679, and then watch the reaction there.
Coin stats: over 90 days +70.31%, over a year -34.25%. This looks like a recovery phase, and the current pause seems more like accumulation than a reversal.
Personally, I’m waiting for confirmation at 2,789. I won’t enter without volume.
How do you read the ETH hourly chart — up, or is there still more downside? $ETH #Ethereum #crypto #трейдинг
$ETH
I’m looking at ETH/USDT on the 1-hour timeframe. After bouncing off 2,564.33, the price moved into a tight range and is now trading around 2,749.71, with a 24-hour change of just +0.69%.
What we see on the hour:
• MA(7) = 2,761.69 and MA(25) = 2,752.60 — the lines are almost stuck together. This is a sign of volatility compression, which is usually followed by an impulse.
• MA(99) = 2,685.06 — the long-term average is lower and rising. This is support in case of a deeper pullback.
• Volumes: 808.83M USDT over 24h, but on the hourly candles activity seems to be fading — the market is building a position.
Key levels on the hour:
• Resistance: 2,789 (24h high), then 2,807.34 (local peak).
• Support: 2,716.02 (24h low); below that is 2,679 (MA99 zone).
My plan:
• Break above 2,789 with rising volume → target 2,807, then 2,850+.
• Lose 2,716 → I’ll wait for a test of 2,679, and then watch the reaction there.
Coin stats: over 90 days +70.31%, over a year -34.25%. This looks like a recovery phase, and the current pause seems more like accumulation than a reversal.
Personally, I’m waiting for confirmation at 2,789. I won’t enter without volume.
How do you read the ETH hourly chart — up, or is there still more downside? $ETH #Ethereum #crypto #трейдинг
$ETH
73
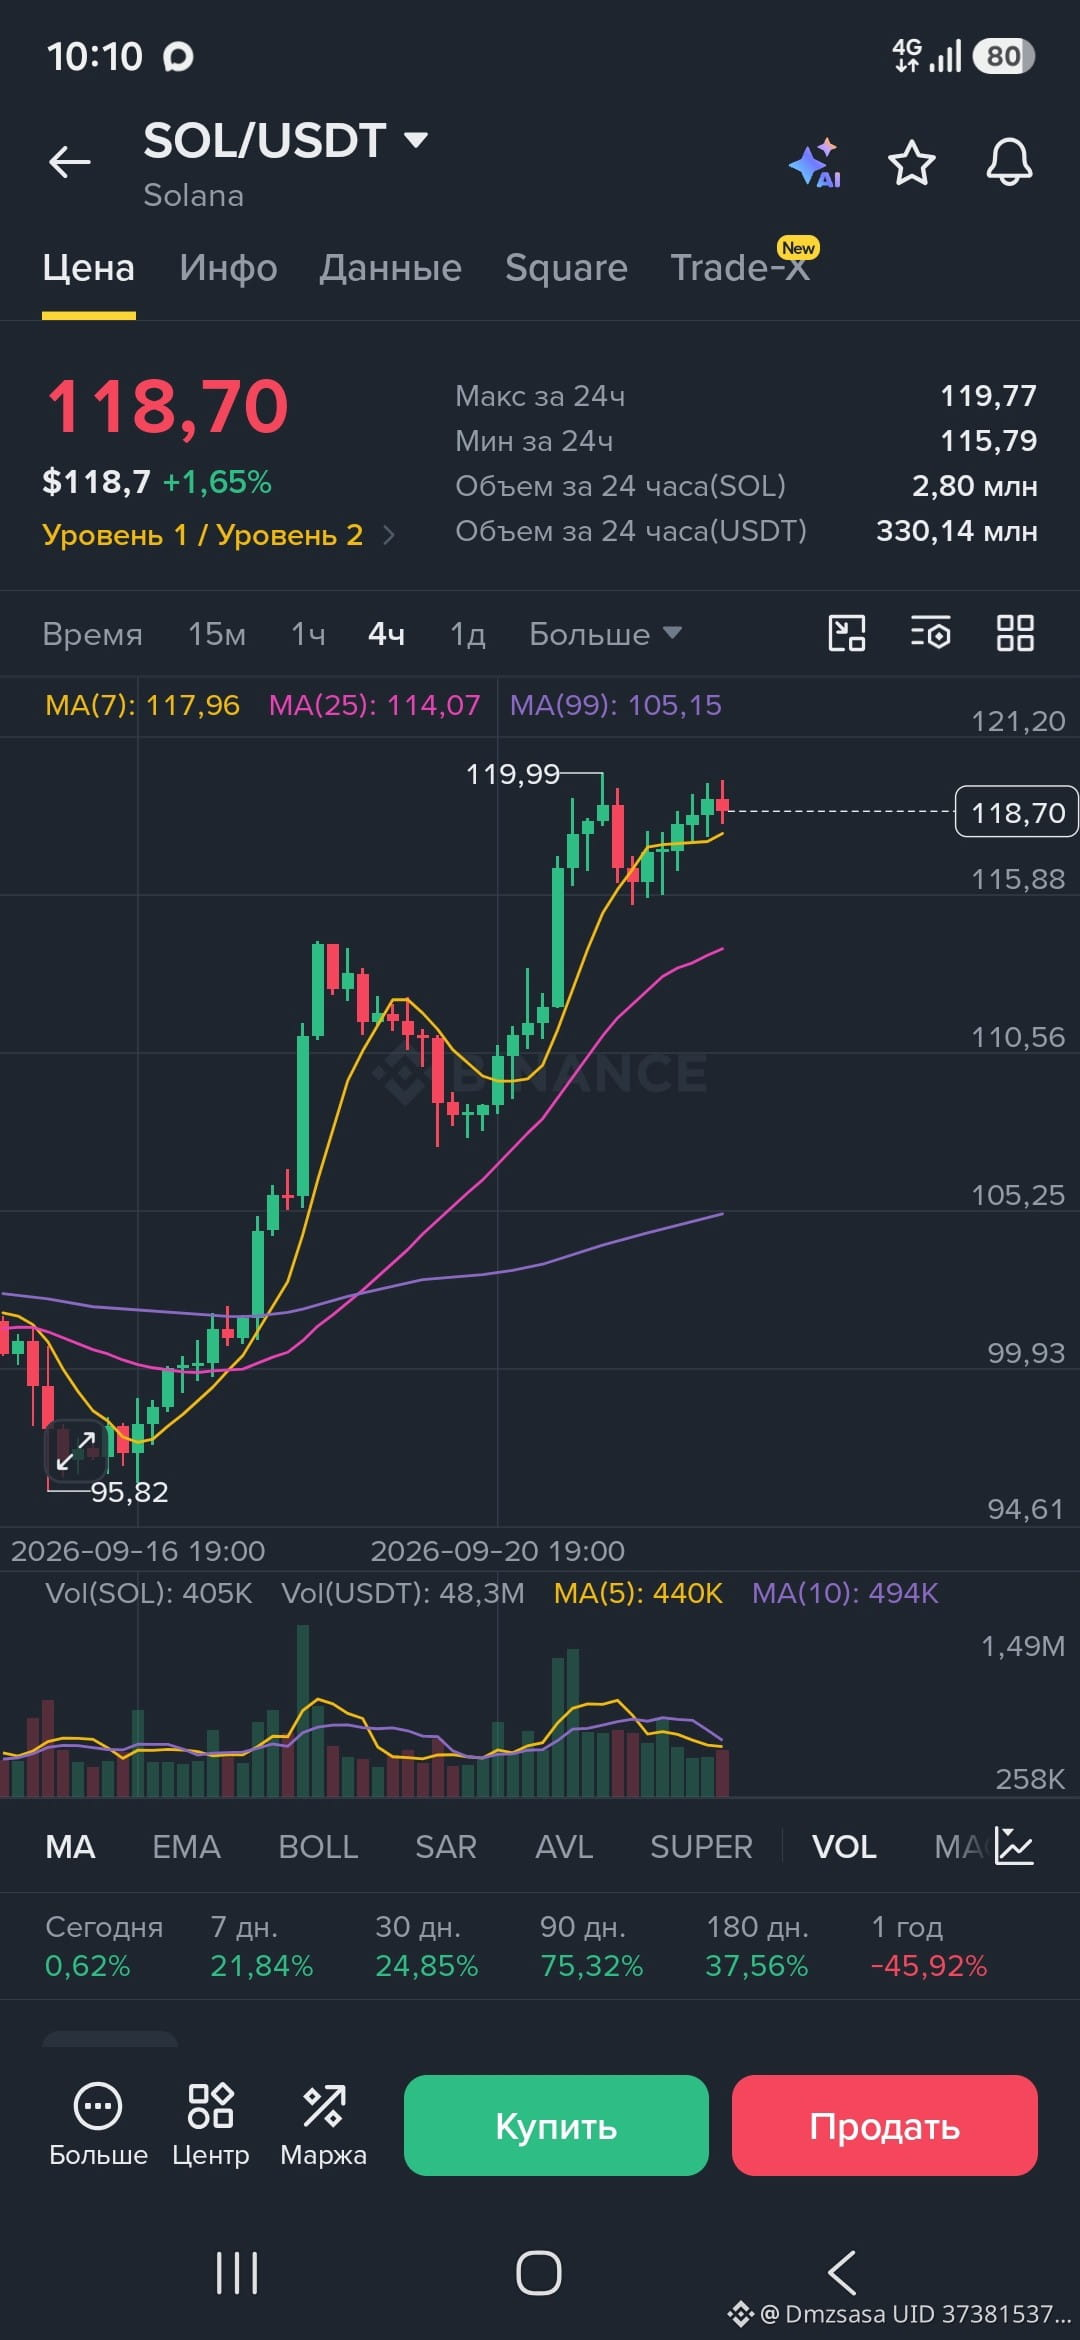
$SOL — recovery after the spill, we look at the levels
On the 4-hour chart, a clear picture is visible: after falling to the local low of 95.82, the price bounced and is now trading around 118.70, up +1.65% over the day.
What the indicators say:
• MA(7) = 117.96 — the price has held above the fast moving average, a locally bullish signal.
• MA(25) = 114.07 and MA(99) = 105.15 — both are below the current price, meaning the medium-term trend is rebuilding upward.
• Volumes over 24 hours: 330.14 million USDT, which is fairly high activity.
Key levels:
• Resistance: 119.77–121.20. If we hold above it, the way is open toward 125+.
• Support: 115.88, then 114 (the MA25 zone).
An interesting point: over the last 90 days SOL is up 75.32%, even though over the year it’s still down (-45.92%). This suggests the coin is actively recouping losses and is in an accumulation phase.
Personally, I’m watching the reaction at the 119.77 level. A break with volume is a continuation signal. A pullback to 114 is a chance to add.
What do you think—will we break 120, or will we first go for a correction? $SOL #Solana #crypto #анализ
{future}(SOLUSDT)
$SOL
$SOL — recovery after the spill, we look at the levels
On the 4-hour chart, a clear picture is visible: after falling to the local low of 95.82, the price bounced and is now trading around 118.70, up +1.65% over the day.
What the indicators say:
• MA(7) = 117.96 — the price has held above the fast moving average, a locally bullish signal.
• MA(25) = 114.07 and MA(99) = 105.15 — both are below the current price, meaning the medium-term trend is rebuilding upward.
• Volumes over 24 hours: 330.14 million USDT, which is fairly high activity.
Key levels:
• Resistance: 119.77–121.20. If we hold above it, the way is open toward 125+.
• Support: 115.88, then 114 (the MA25 zone).
An interesting point: over the last 90 days SOL is up 75.32%, even though over the year it’s still down (-45.92%). This suggests the coin is actively recouping losses and is in an accumulation phase.
Personally, I’m watching the reaction at the 119.77 level. A break with volume is a continuation signal. A pullback to 114 is a chance to add.
What do you think—will we break 120, or will we first go for a correction? $SOL #Solana #crypto #анализ
$SOL
On the 4-hour chart, a clear picture is visible: after falling to the local low of 95.82, the price bounced and is now trading around 118.70, up +1.65% over the day.
What the indicators say:
• MA(7) = 117.96 — the price has held above the fast moving average, a locally bullish signal.
• MA(25) = 114.07 and MA(99) = 105.15 — both are below the current price, meaning the medium-term trend is rebuilding upward.
• Volumes over 24 hours: 330.14 million USDT, which is fairly high activity.
Key levels:
• Resistance: 119.77–121.20. If we hold above it, the way is open toward 125+.
• Support: 115.88, then 114 (the MA25 zone).
An interesting point: over the last 90 days SOL is up 75.32%, even though over the year it’s still down (-45.92%). This suggests the coin is actively recouping losses and is in an accumulation phase.
Personally, I’m watching the reaction at the 119.77 level. A break with volume is a continuation signal. A pullback to 114 is a chance to add.
What do you think—will we break 120, or will we first go for a correction? $SOL #Solana #crypto #анализ
$SOL
110
·
--
Bearish
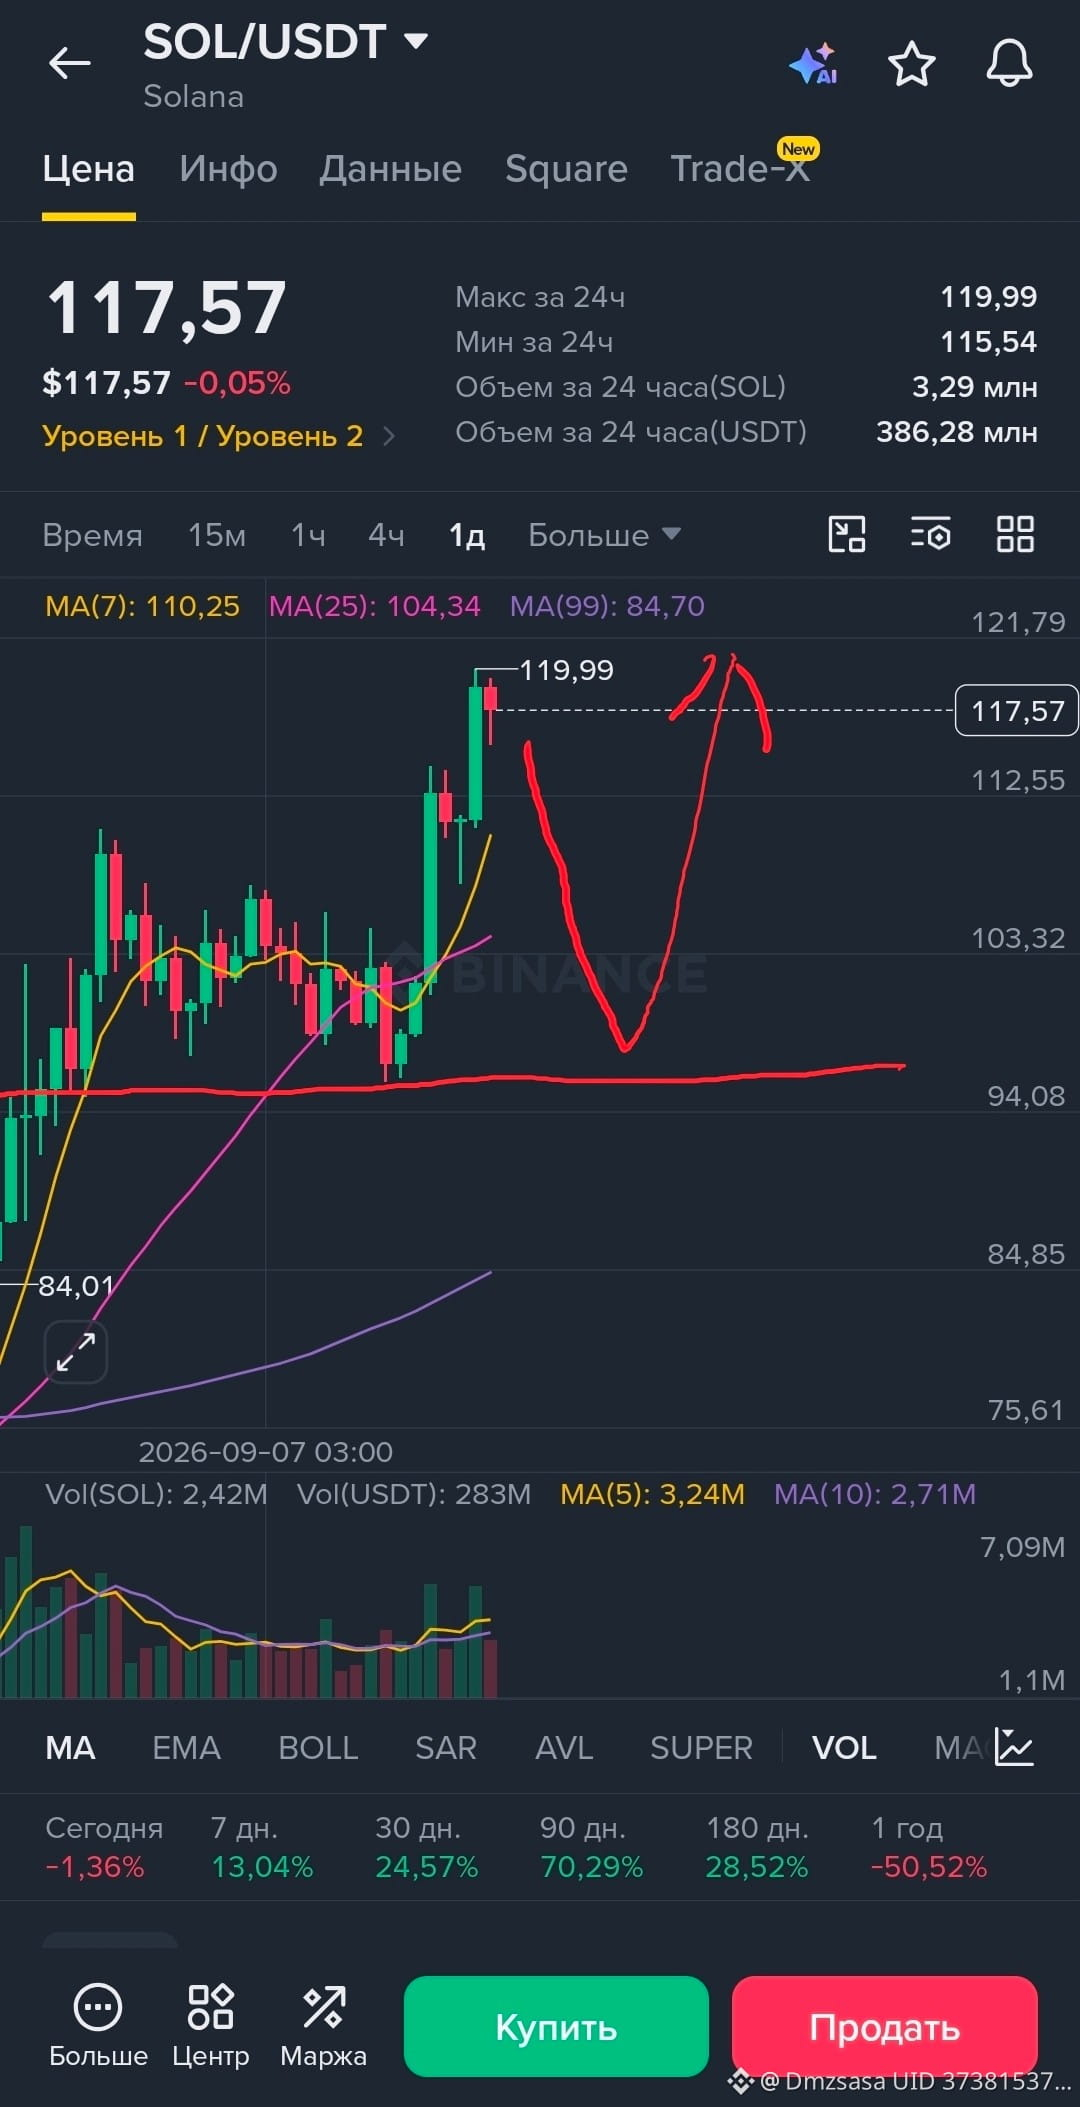
🔥 LAST CHANCE TO ENTER THE SHORT ON SOL? OR AM I MISSING SOMETHING? 🔥
Look at this screenshot. In 90 days, Solana made +70%, but now the chart is gasping for air. At the $119.99 level, large sellers are sitting.
I drew a scenario (red line), and it’s not rosy. The price is stuck at $117.57, momentum is fading.
📉 This is the perfect storm for a correction. If we break $112.55, panic will start.
Where are we headed? Look at $104** (MA25) and below, toward **$94**.
Selling at these highs is the best decision right now. Don’t be that same hamster who buys at the peak! 🐹
Write in the comments "SELL" if you also see this reversal! 👇
leave a like.
{future}(SOLUSDT)
$SOL
🔥 LAST CHANCE TO ENTER THE SHORT ON SOL? OR AM I MISSING SOMETHING? 🔥
Look at this screenshot. In 90 days, Solana made +70%, but now the chart is gasping for air. At the $119.99 level, large sellers are sitting.
I drew a scenario (red line), and it’s not rosy. The price is stuck at $117.57, momentum is fading.
📉 This is the perfect storm for a correction. If we break $112.55, panic will start.
Where are we headed? Look at $104** (MA25) and below, toward **$94**.
Selling at these highs is the best decision right now. Don’t be that same hamster who buys at the peak! 🐹
Write in the comments "SELL" if you also see this reversal! 👇
leave a like.
$SOL
Look at this screenshot. In 90 days, Solana made +70%, but now the chart is gasping for air. At the $119.99 level, large sellers are sitting.
I drew a scenario (red line), and it’s not rosy. The price is stuck at $117.57, momentum is fading.
📉 This is the perfect storm for a correction. If we break $112.55, panic will start.
Where are we headed? Look at $104** (MA25) and below, toward **$94**.
Selling at these highs is the best decision right now. Don’t be that same hamster who buys at the peak! 🐹
Write in the comments "SELL" if you also see this reversal! 👇
leave a like.
$SOL
29
·
--
Bearish
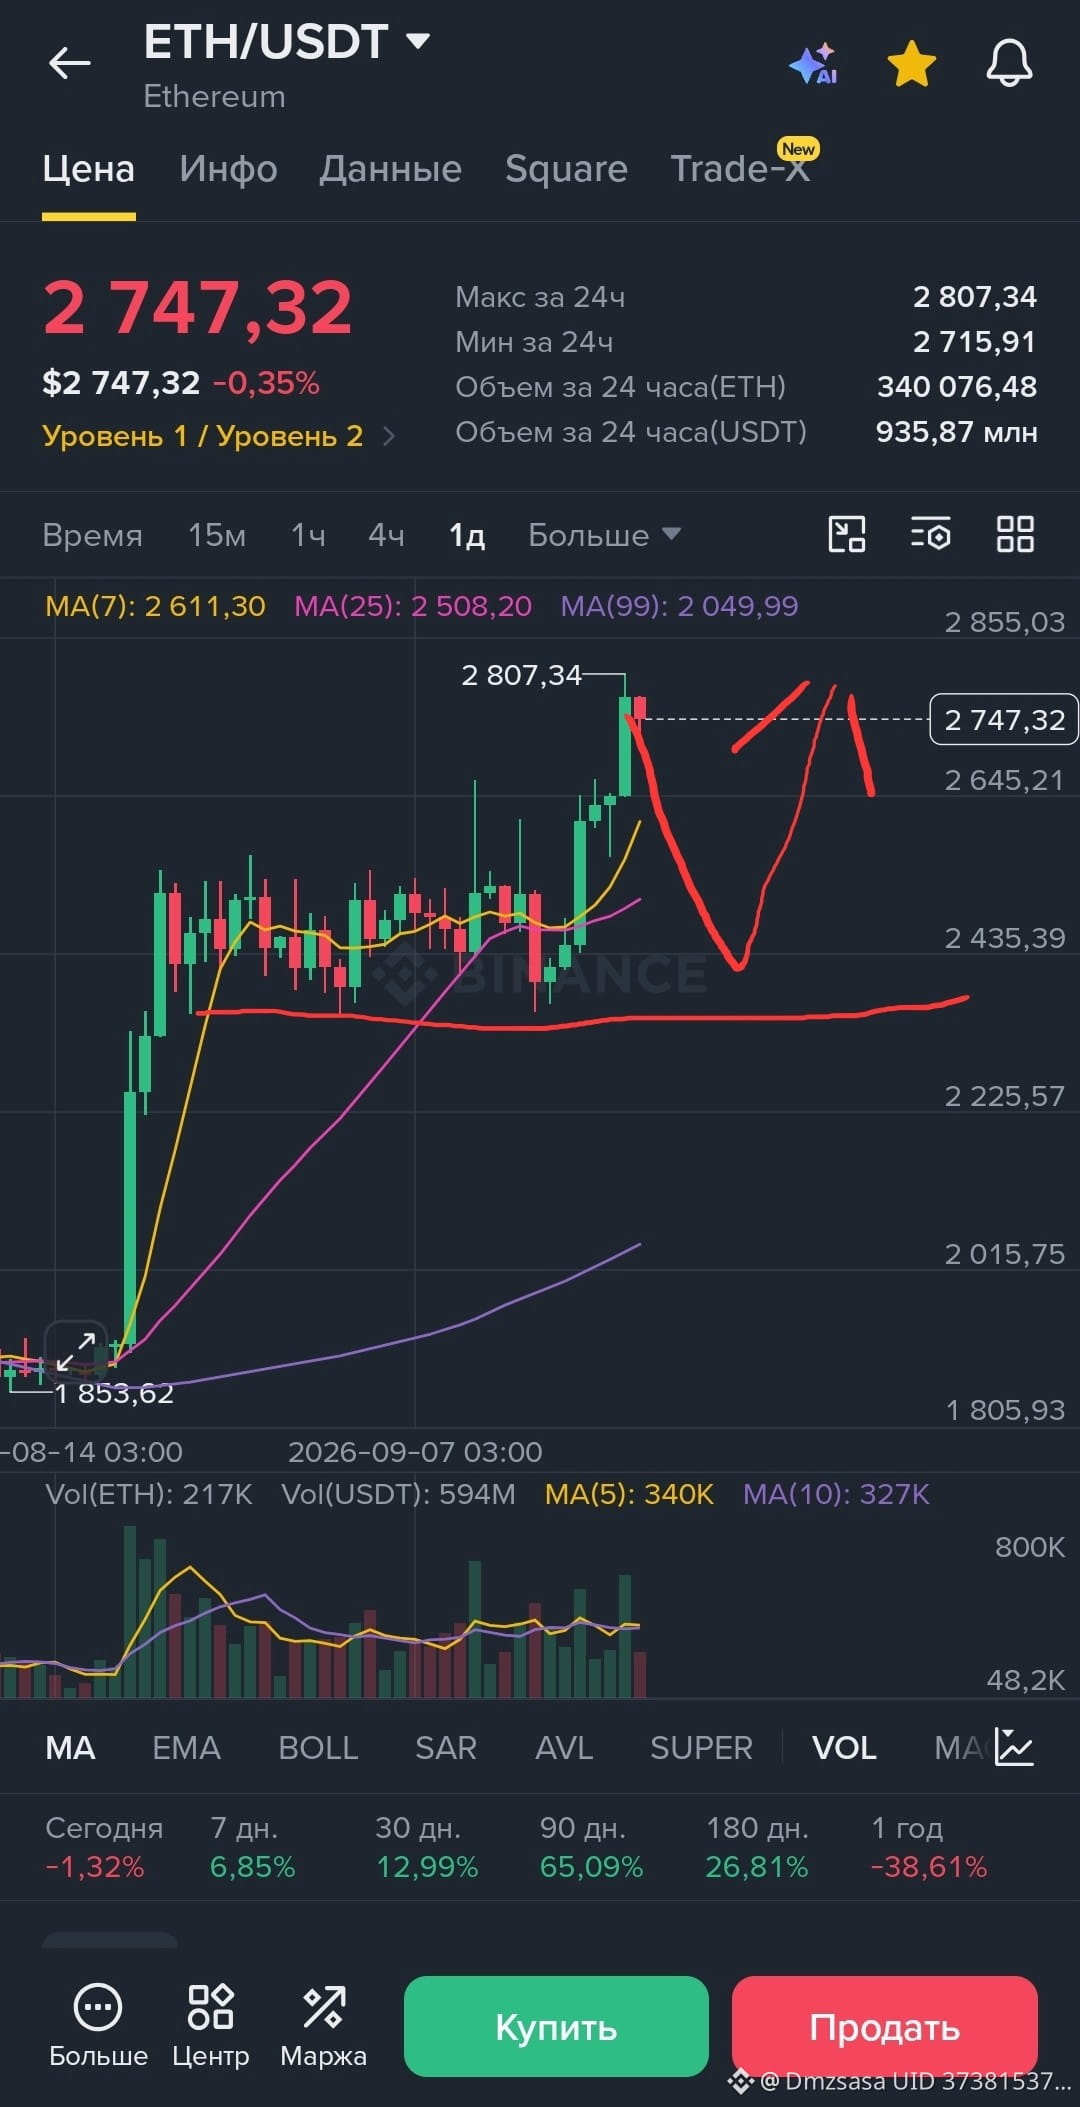
🚨 URGENT! LIVE ON THE EDGE OF A COLLAPSE? I SEE A REVERSAL PATTERN! 🚨
Friends, let’s look at the $ETH chart. We clearly hit the ceiling of **2807$**, and now a classic "Head and Shoulders" pattern is forming. This is a bearish signal!
📉 Price has already bounced off the high and is currently hovering around 2747$. If we break the support, we’ll fly down—no way around it.
My downside targets:
🎯 First target: 2435$** (MA25 also lines up here)
🎯 Second target: **2225$
I’ve already opened a SHORT and locked in profit. Don’t wait until the train leaves—the market doesn’t forgive greed! Who’s with me in the red? 👇
ставте лайск .
{future}(ETHUSDT)
$ETH
🚨 URGENT! LIVE ON THE EDGE OF A COLLAPSE? I SEE A REVERSAL PATTERN! 🚨
Friends, let’s look at the $ETH chart. We clearly hit the ceiling of **2807$**, and now a classic "Head and Shoulders" pattern is forming. This is a bearish signal!
📉 Price has already bounced off the high and is currently hovering around 2747$. If we break the support, we’ll fly down—no way around it.
My downside targets:
🎯 First target: 2435$** (MA25 also lines up here)
🎯 Second target: **2225$
I’ve already opened a SHORT and locked in profit. Don’t wait until the train leaves—the market doesn’t forgive greed! Who’s with me in the red? 👇
ставте лайск .
$ETH
Friends, let’s look at the $ETH chart. We clearly hit the ceiling of **2807$**, and now a classic "Head and Shoulders" pattern is forming. This is a bearish signal!
📉 Price has already bounced off the high and is currently hovering around 2747$. If we break the support, we’ll fly down—no way around it.
My downside targets:
🎯 First target: 2435$** (MA25 also lines up here)
🎯 Second target: **2225$
I’ve already opened a SHORT and locked in profit. Don’t wait until the train leaves—the market doesn’t forgive greed! Who’s with me in the red? 👇
ставте лайск .
$ETH
53
·
--
Bearish
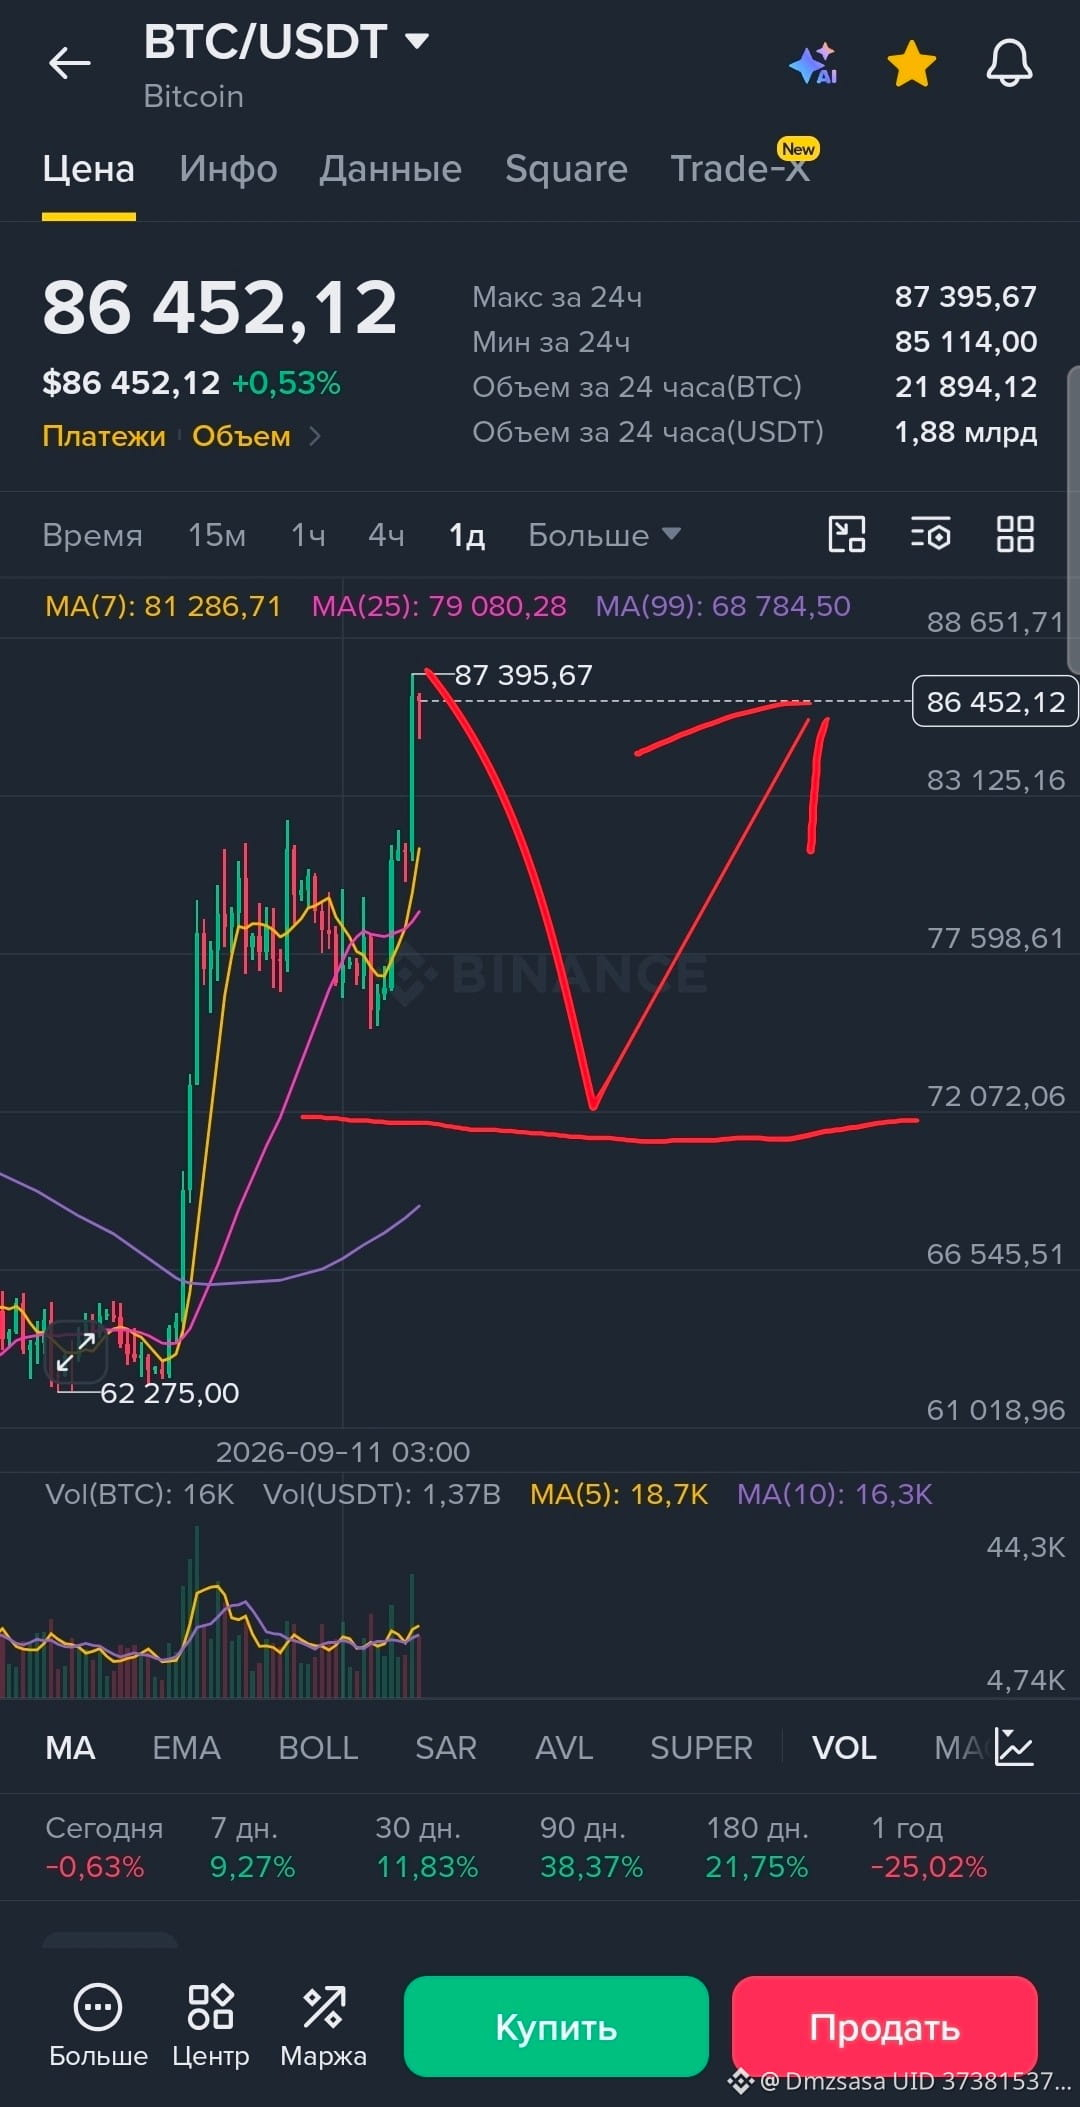
🚨 $BTC: We’re preparing for a drop! Short from the current price.
I’m seeing a classic bull trap. Price has hit resistance, volume is falling, and market euphoria is through the roof. Time to enter a sell! 📉
🎯 My plan:
· Entry: Current price (86,400$)
· Target: 73,000$ (we take liquidity and stops)
· Stop: Above the local high (87,500$)
Who’s with me on the short? Who’s ready to grab their x’s in the panic? Hit like if you’re waiting for red candles!
{future}(BTCUSDT)
$BTC
🚨 $BTC : We’re preparing for a drop! Short from the current price.
I’m seeing a classic bull trap. Price has hit resistance, volume is falling, and market euphoria is through the roof. Time to enter a sell! 📉
🎯 My plan:
· Entry: Current price (86,400$)
· Target: 73,000$ (we take liquidity and stops)
· Stop: Above the local high (87,500$)
Who’s with me on the short? Who’s ready to grab their x’s in the panic? Hit like if you’re waiting for red candles!
$BTC
I’m seeing a classic bull trap. Price has hit resistance, volume is falling, and market euphoria is through the roof. Time to enter a sell! 📉
🎯 My plan:
· Entry: Current price (86,400$)
· Target: 73,000$ (we take liquidity and stops)
· Stop: Above the local high (87,500$)
Who’s with me on the short? Who’s ready to grab their x’s in the panic? Hit like if you’re waiting for red candles!
$BTC
35
·
--
Bullish
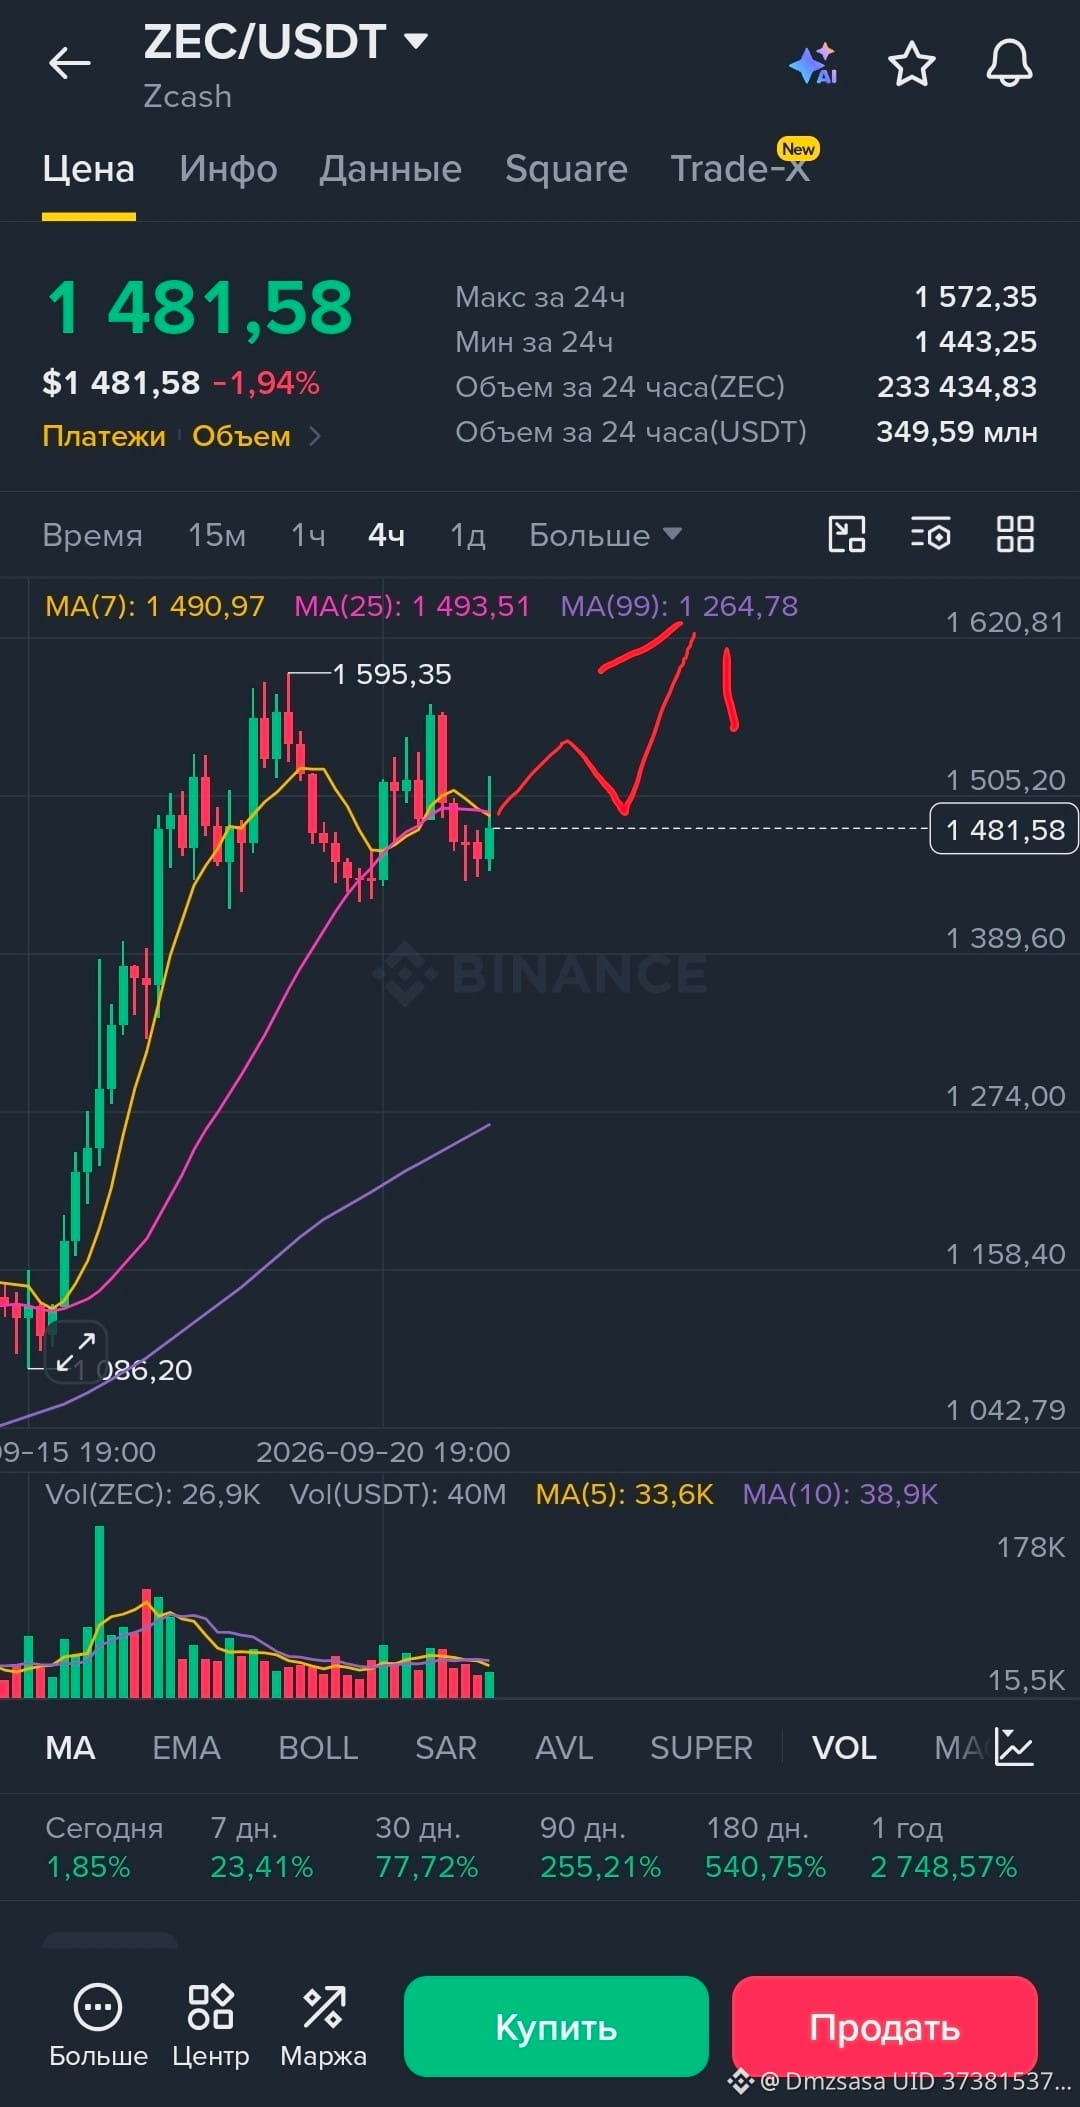
$ZEC — this isn’t just hype, it’s pure FOMO. 🚀
I’m going into a big long. I feel that momentum. I love moments like these.
Entry point: The market (right now)
Stop-loss: 1410 (discipline comes first)
Take-profit: 1550 — 1600 — 1650 — 1700 — 1800
Don’t thank me. Let’s go 👇
{future}(ZECUSDT)
$ZEC
$ZEC — this isn’t just hype, it’s pure FOMO. 🚀
I’m going into a big long. I feel that momentum. I love moments like these.
Entry point: The market (right now)
Stop-loss: 1410 (discipline comes first)
Take-profit: 1550 — 1600 — 1650 — 1700 — 1800
Don’t thank me. Let’s go 👇
$ZEC
I’m going into a big long. I feel that momentum. I love moments like these.
Entry point: The market (right now)
Stop-loss: 1410 (discipline comes first)
Take-profit: 1550 — 1600 — 1650 — 1700 — 1800
Don’t thank me. Let’s go 👇
$ZEC
35
$DOGE +14%, $PEPE +32% in 24 hours. Meme coins woke up — but I’m not buying.
Here’s why.
Today, old memes suddenly surged: PEPE +32%, WIF +27%, DOGE +18%, FLOKI +15%. At first glance—“altseason has arrived.” But dig deeper: BTC has just gained +13% in 4 days and hit $87,381, after which it pulled back. Memes are rising along with Bitcoin, not on their own.
This is a classic trap: when BTC makes a sharp move, liquidity flows into memes because people are hunting for “x’s.” But the moment Bitcoin stalls, memes dump first—and they hurt the most.
What I’m doing: I’m watching, not entering. If $DOGE holds $0.10 as support after the pullback—then it’s worth looking at. If it breaks down—then it was just a pump from short liquidations.$
Are you already in memes, or waiting for the pullback? Write in the comments which coin you’re watching.
Subscribe—we’ll keep breaking down crypto: alts, P2P, security.
{spot}(PEPEUSDT)
{future}(DOGEUSDT)
{future}(WIFUSDT)
$DOGE +14%, $PEPE +32% in 24 hours. Meme coins woke up — but I’m not buying.
Here’s why.
Today, old memes suddenly surged: PEPE +32%, WIF +27%, DOGE +18%, FLOKI +15%. At first glance—“altseason has arrived.” But dig deeper: BTC has just gained +13% in 4 days and hit $87,381, after which it pulled back. Memes are rising along with Bitcoin, not on their own.
This is a classic trap: when BTC makes a sharp move, liquidity flows into memes because people are hunting for “x’s.” But the moment Bitcoin stalls, memes dump first—and they hurt the most.
What I’m doing: I’m watching, not entering. If $DOGE holds $0.10 as support after the pullback—then it’s worth looking at. If it breaks down—then it was just a pump from short liquidations.$
Are you already in memes, or waiting for the pullback? Write in the comments which coin you’re watching.
Subscribe—we’ll keep breaking down crypto: alts, P2P, security.
Here’s why.
Today, old memes suddenly surged: PEPE +32%, WIF +27%, DOGE +18%, FLOKI +15%. At first glance—“altseason has arrived.” But dig deeper: BTC has just gained +13% in 4 days and hit $87,381, after which it pulled back. Memes are rising along with Bitcoin, not on their own.
This is a classic trap: when BTC makes a sharp move, liquidity flows into memes because people are hunting for “x’s.” But the moment Bitcoin stalls, memes dump first—and they hurt the most.
What I’m doing: I’m watching, not entering. If $DOGE holds $0.10 as support after the pullback—then it’s worth looking at. If it breaks down—then it was just a pump from short liquidations.$
Are you already in memes, or waiting for the pullback? Write in the comments which coin you’re watching.
Subscribe—we’ll keep breaking down crypto: alts, P2P, security.
49
·
--
Bullish
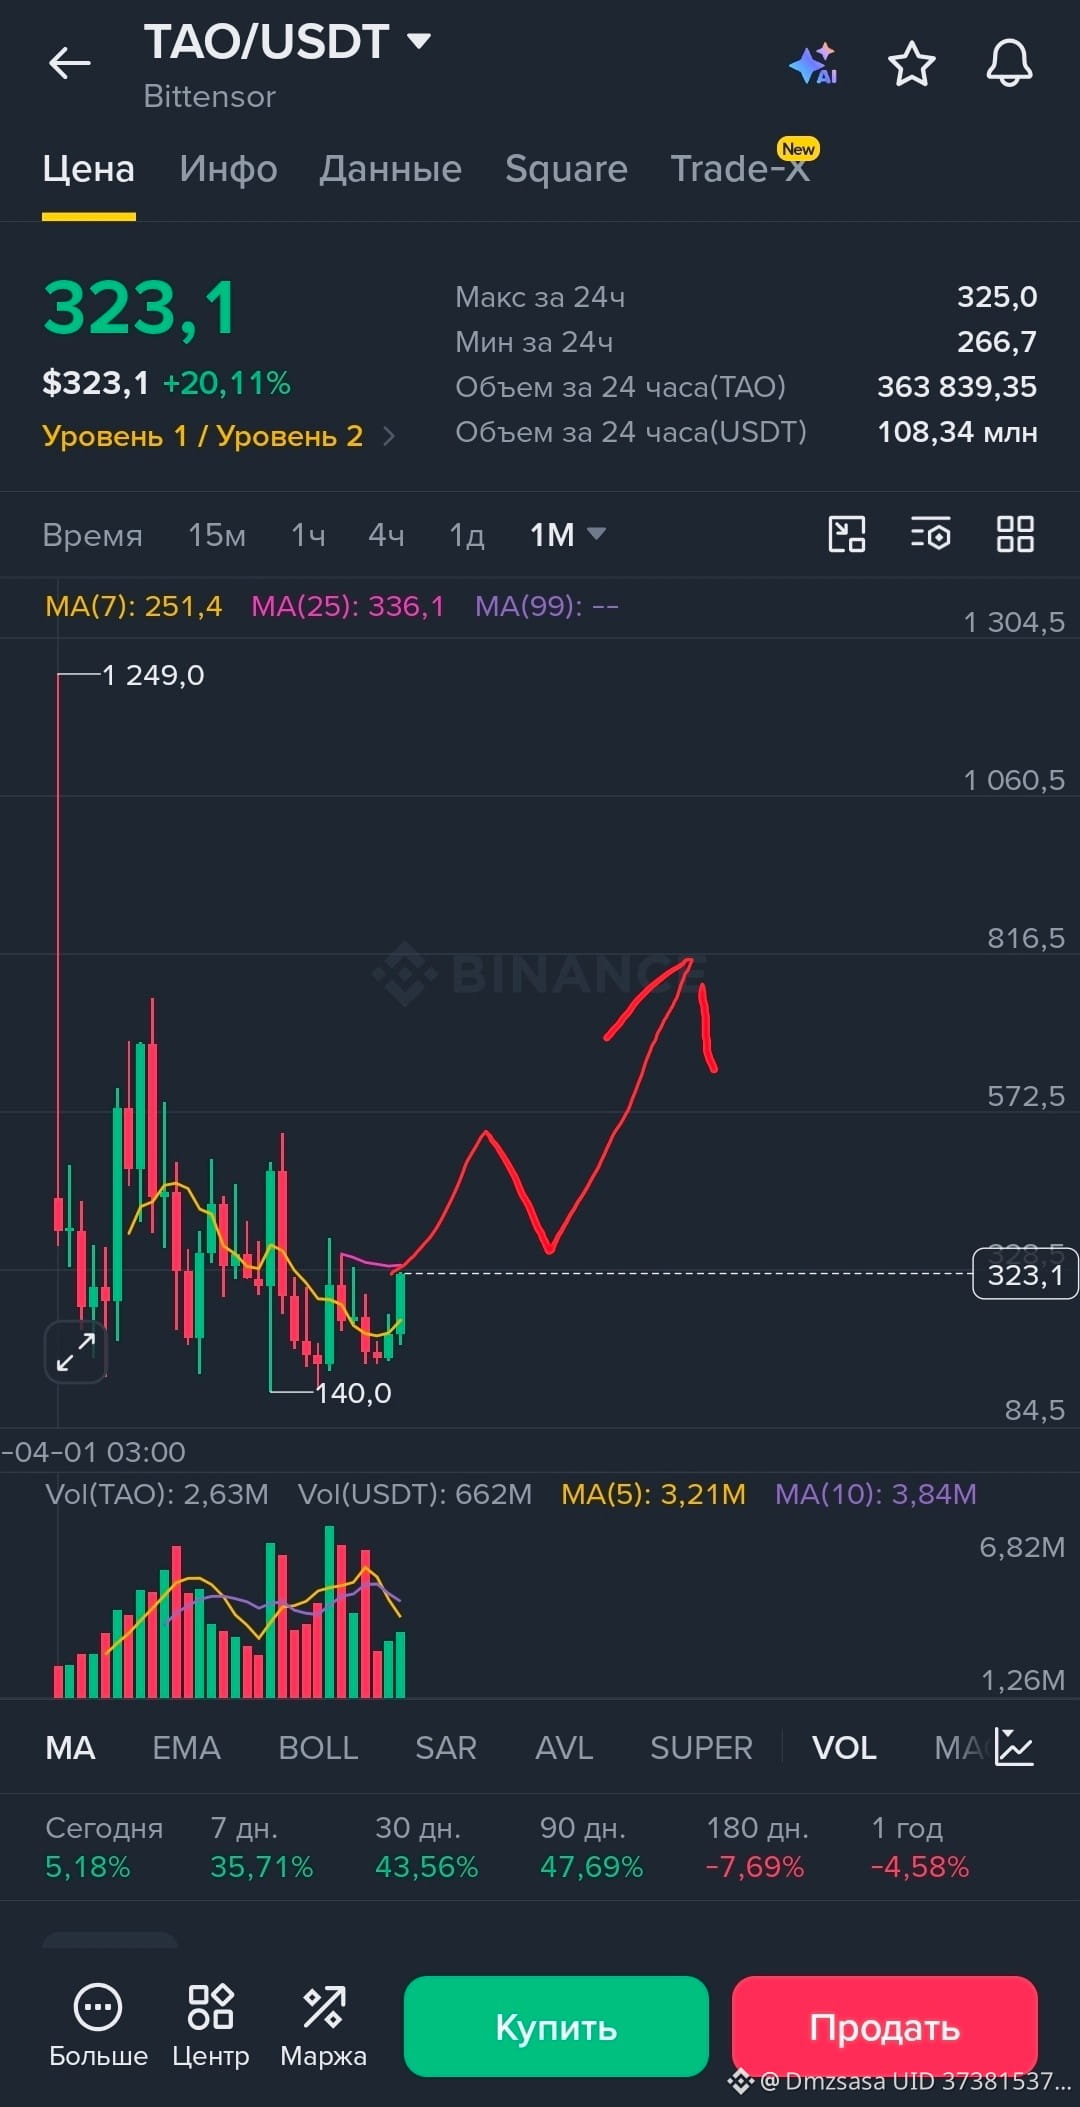
$TAO: Accumulation before the impulse? Getting ready for a long.
Don’t miss a potential TAO rally. The market may be stuck in a prolonged sideways phase, but as practice shows, the exit from such ranges is often fast and explosive.
Trade setup (Long):
🟢 Entry zone: $305 – $325
🎯 Targets (TP): $340 – $360 – $380 – $410 – $510
🛑 **Stop-loss (SL):** $289
{future}(TAOUSDT)
$TAO
$TAO : Accumulation before the impulse? Getting ready for a long.
Don’t miss a potential TAO rally. The market may be stuck in a prolonged sideways phase, but as practice shows, the exit from such ranges is often fast and explosive.
Trade setup (Long):
🟢 Entry zone: $305 – $325
🎯 Targets (TP): $340 – $360 – $380 – $410 – $510
🛑 **Stop-loss (SL):** $289
$TAO
Don’t miss a potential TAO rally. The market may be stuck in a prolonged sideways phase, but as practice shows, the exit from such ranges is often fast and explosive.
Trade setup (Long):
🟢 Entry zone: $305 – $325
🎯 Targets (TP): $340 – $360 – $380 – $410 – $510
🛑 **Stop-loss (SL):** $289
$TAO
39
·
--
Bullish
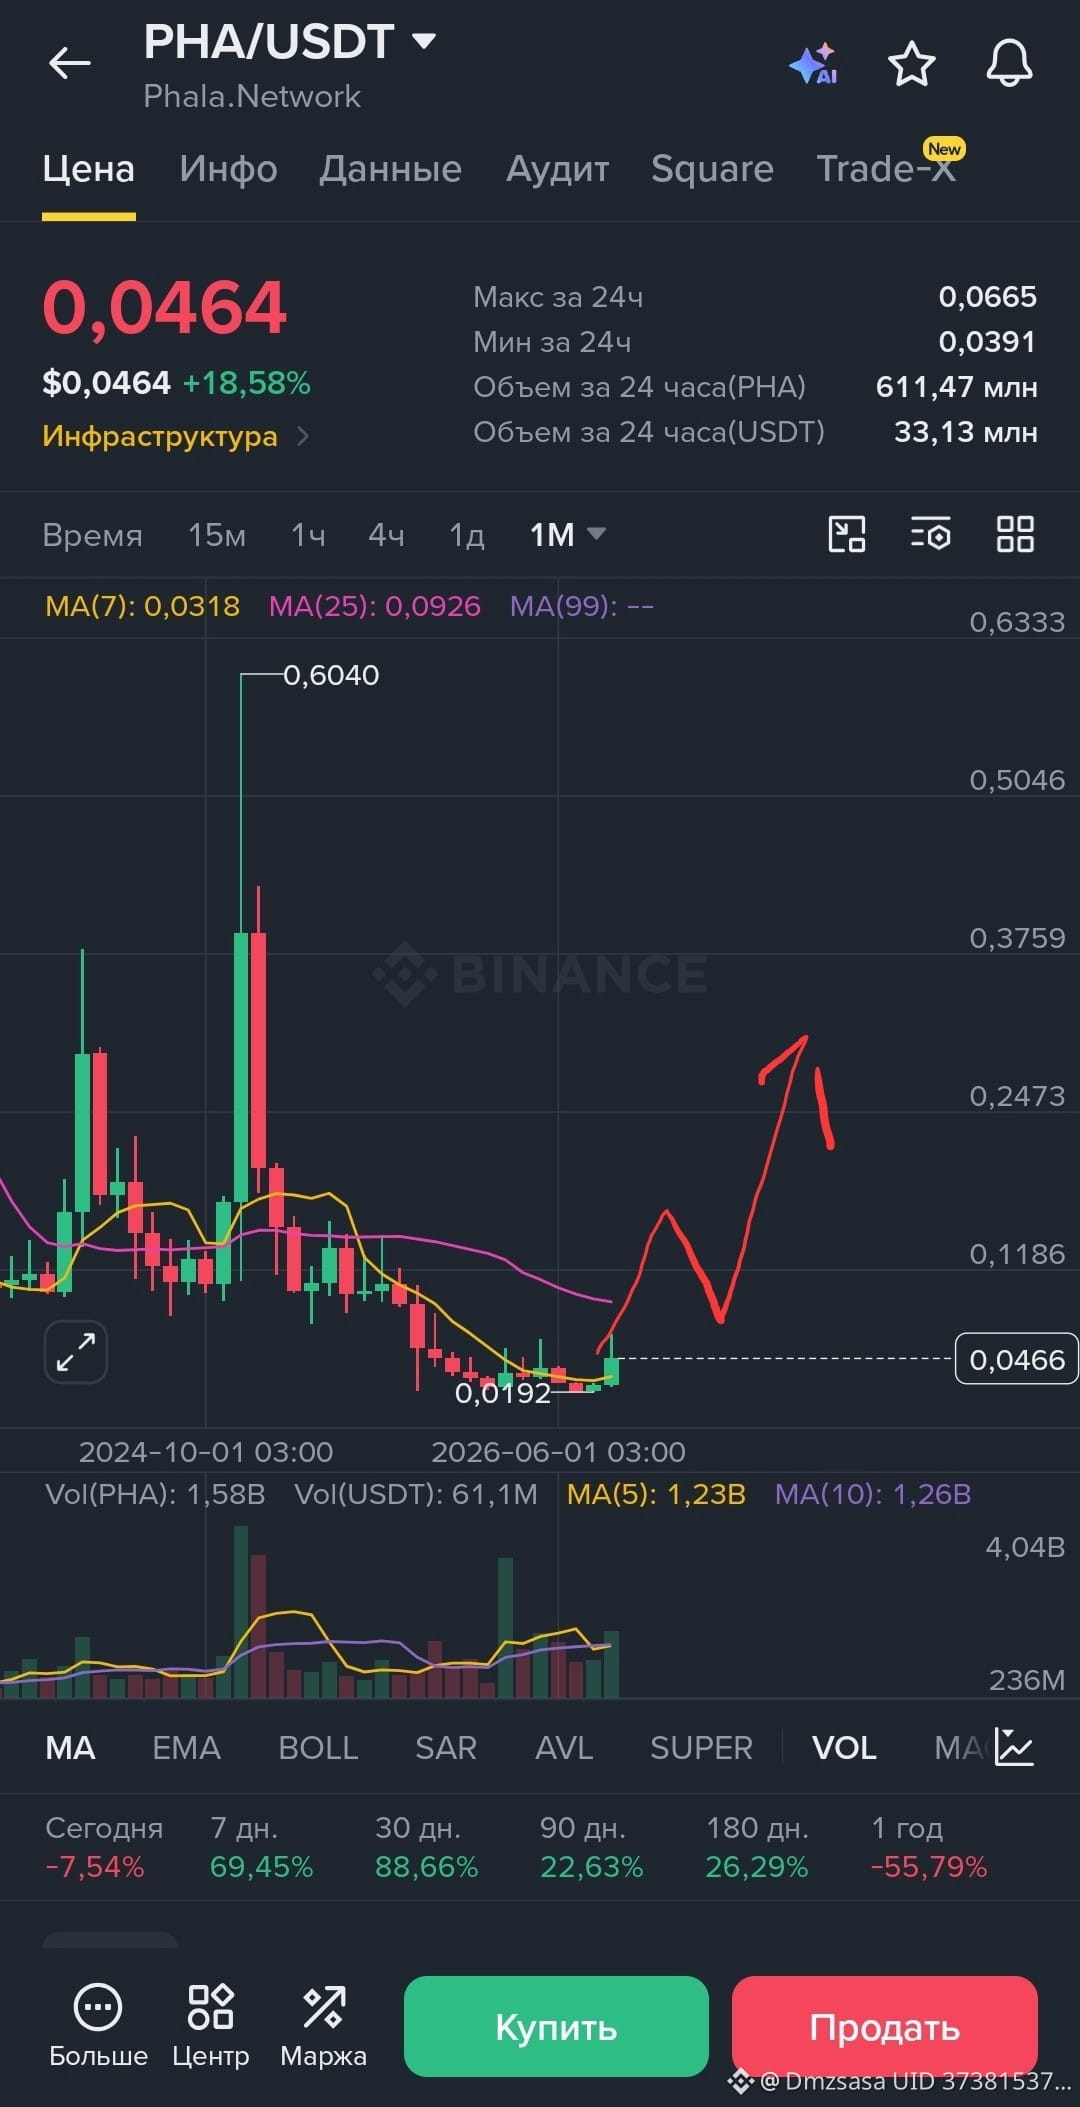
$PHA silently builds a base. Big long is back in the game! 👀
See how the price is holding at long-term support? This is a classic accumulation. A breakout above **$0.09** could become the trigger for a pump move toward $0.16, $0.31, and even $0.46.
My plan:
🟢 Entry: $0.048 – $0.055
🔴 Stop: $0.039
🎯 **Targets:** $0.065 | $0.075 | $0.086 | $0.09 | $0.17 | $0.33 | $0.48
Patience is key here. Whoever enters now will thank themselves later. 📈
{future}(PHAUSDT)
$PHA
$PHA silently builds a base. Big long is back in the game! 👀
See how the price is holding at long-term support? This is a classic accumulation. A breakout above **$0.09** could become the trigger for a pump move toward $0.16, $0.31, and even $0.46.
My plan:
🟢 Entry: $0.048 – $0.055
🔴 Stop: $0.039
🎯 **Targets:** $0.065 | $0.075 | $0.086 | $0.09 | $0.17 | $0.33 | $0.48
Patience is key here. Whoever enters now will thank themselves later. 📈
$PHA
See how the price is holding at long-term support? This is a classic accumulation. A breakout above **$0.09** could become the trigger for a pump move toward $0.16, $0.31, and even $0.46.
My plan:
🟢 Entry: $0.048 – $0.055
🔴 Stop: $0.039
🎯 **Targets:** $0.065 | $0.075 | $0.086 | $0.09 | $0.17 | $0.33 | $0.48
Patience is key here. Whoever enters now will thank themselves later. 📈
$PHA
74
I almost bought $BTC on the peak yesterday. Here’s why I didn’t.
Bitcoin broke through $87,000 and pulled back to $86,600. Up +13% in 4 days, but this is a short squeeze—shorts were squeezed for $800 million. The fuel is running out.
The $84,000 level is the dividing line. Holding it means a trend change. Breaking it means yesterday’s pump was a trap.
I’m not entering. I’m waiting either for a hold above $87,000, or a drop to $82,000–$83,000.
Have you entered, or are you waiting? Honestly.
Subscribe—next we’ll break down crypto: alts, P2P, and security.
Not investment advice.
{future}(BTCUSDT)
$BTC
I almost bought $BTC on the peak yesterday. Here’s why I didn’t.
Bitcoin broke through $87,000 and pulled back to $86,600. Up +13% in 4 days, but this is a short squeeze—shorts were squeezed for $800 million. The fuel is running out.
The $84,000 level is the dividing line. Holding it means a trend change. Breaking it means yesterday’s pump was a trap.
I’m not entering. I’m waiting either for a hold above $87,000, or a drop to $82,000–$83,000.
Have you entered, or are you waiting? Honestly.
Subscribe—next we’ll break down crypto: alts, P2P, and security.
Not investment advice.
$BTC
Bitcoin broke through $87,000 and pulled back to $86,600. Up +13% in 4 days, but this is a short squeeze—shorts were squeezed for $800 million. The fuel is running out.
The $84,000 level is the dividing line. Holding it means a trend change. Breaking it means yesterday’s pump was a trap.
I’m not entering. I’m waiting either for a hold above $87,000, or a drop to $82,000–$83,000.
Have you entered, or are you waiting? Honestly.
Subscribe—next we’ll break down crypto: alts, P2P, and security.
Not investment advice.
$BTC
51
·
--
Bearish
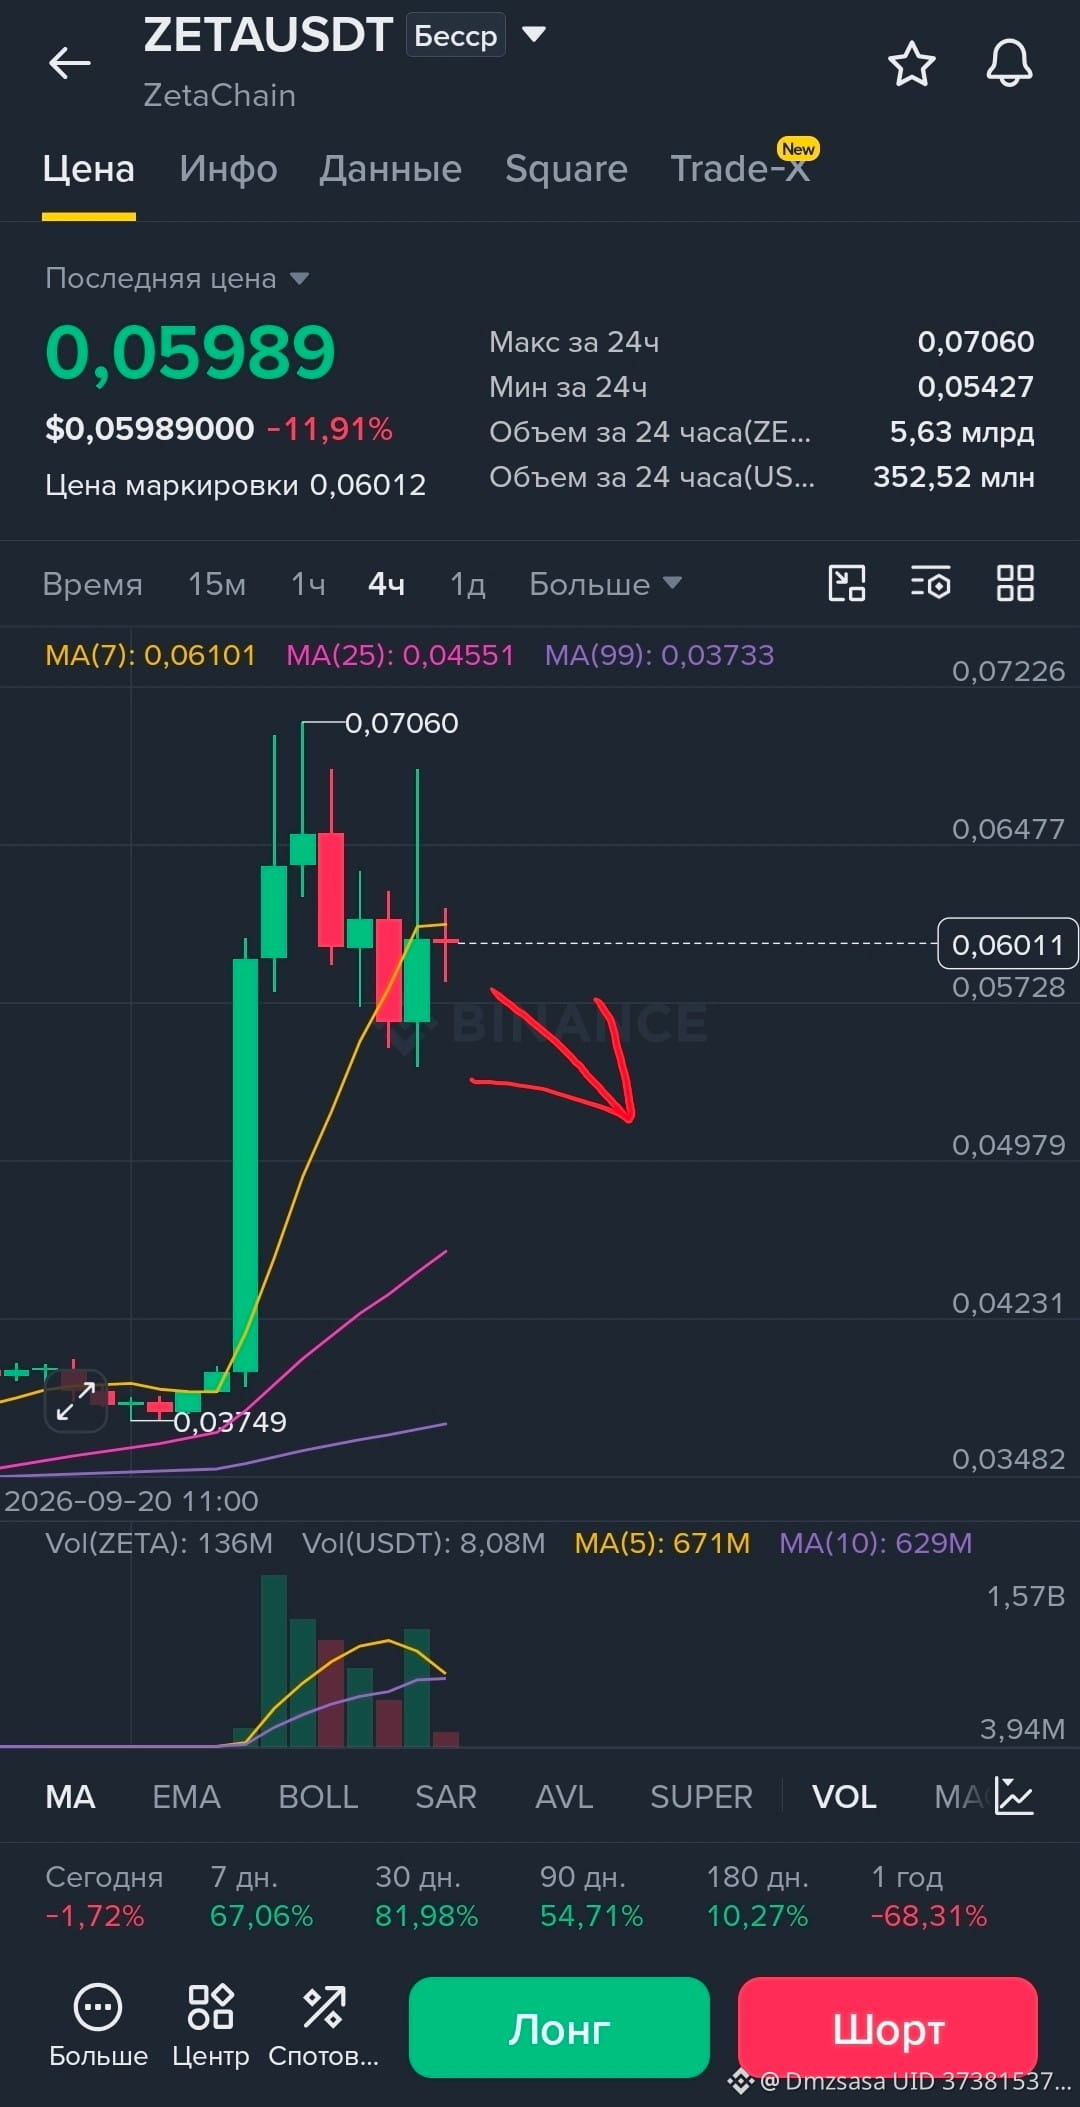
$ZETA — GET READY FOR THE FALL! 🩸
I see a large pattern on the chart. Bears are taking control. This is a great opportunity for those who know how to profit from a decline.
🎯 Goals and risks:
🛑 Stop: 0.069 (must be followed!)
💰 Target: 0.041 (take profit)
It will be too late later! Enter a short right now.
👇 SHORT $ZETA
{future}(ZETAUSDT)
$ZETA
$ZETA — GET READY FOR THE FALL! 🩸
I see a large pattern on the chart. Bears are taking control. This is a great opportunity for those who know how to profit from a decline.
🎯 Goals and risks:
🛑 Stop: 0.069 (must be followed!)
💰 Target: 0.041 (take profit)
It will be too late later! Enter a short right now.
👇 SHORT $ZETA
$ZETA
I see a large pattern on the chart. Bears are taking control. This is a great opportunity for those who know how to profit from a decline.
🎯 Goals and risks:
🛑 Stop: 0.069 (must be followed!)
💰 Target: 0.041 (take profit)
It will be too late later! Enter a short right now.
👇 SHORT $ZETA
$ZETA
1
58
·
--
Bullish
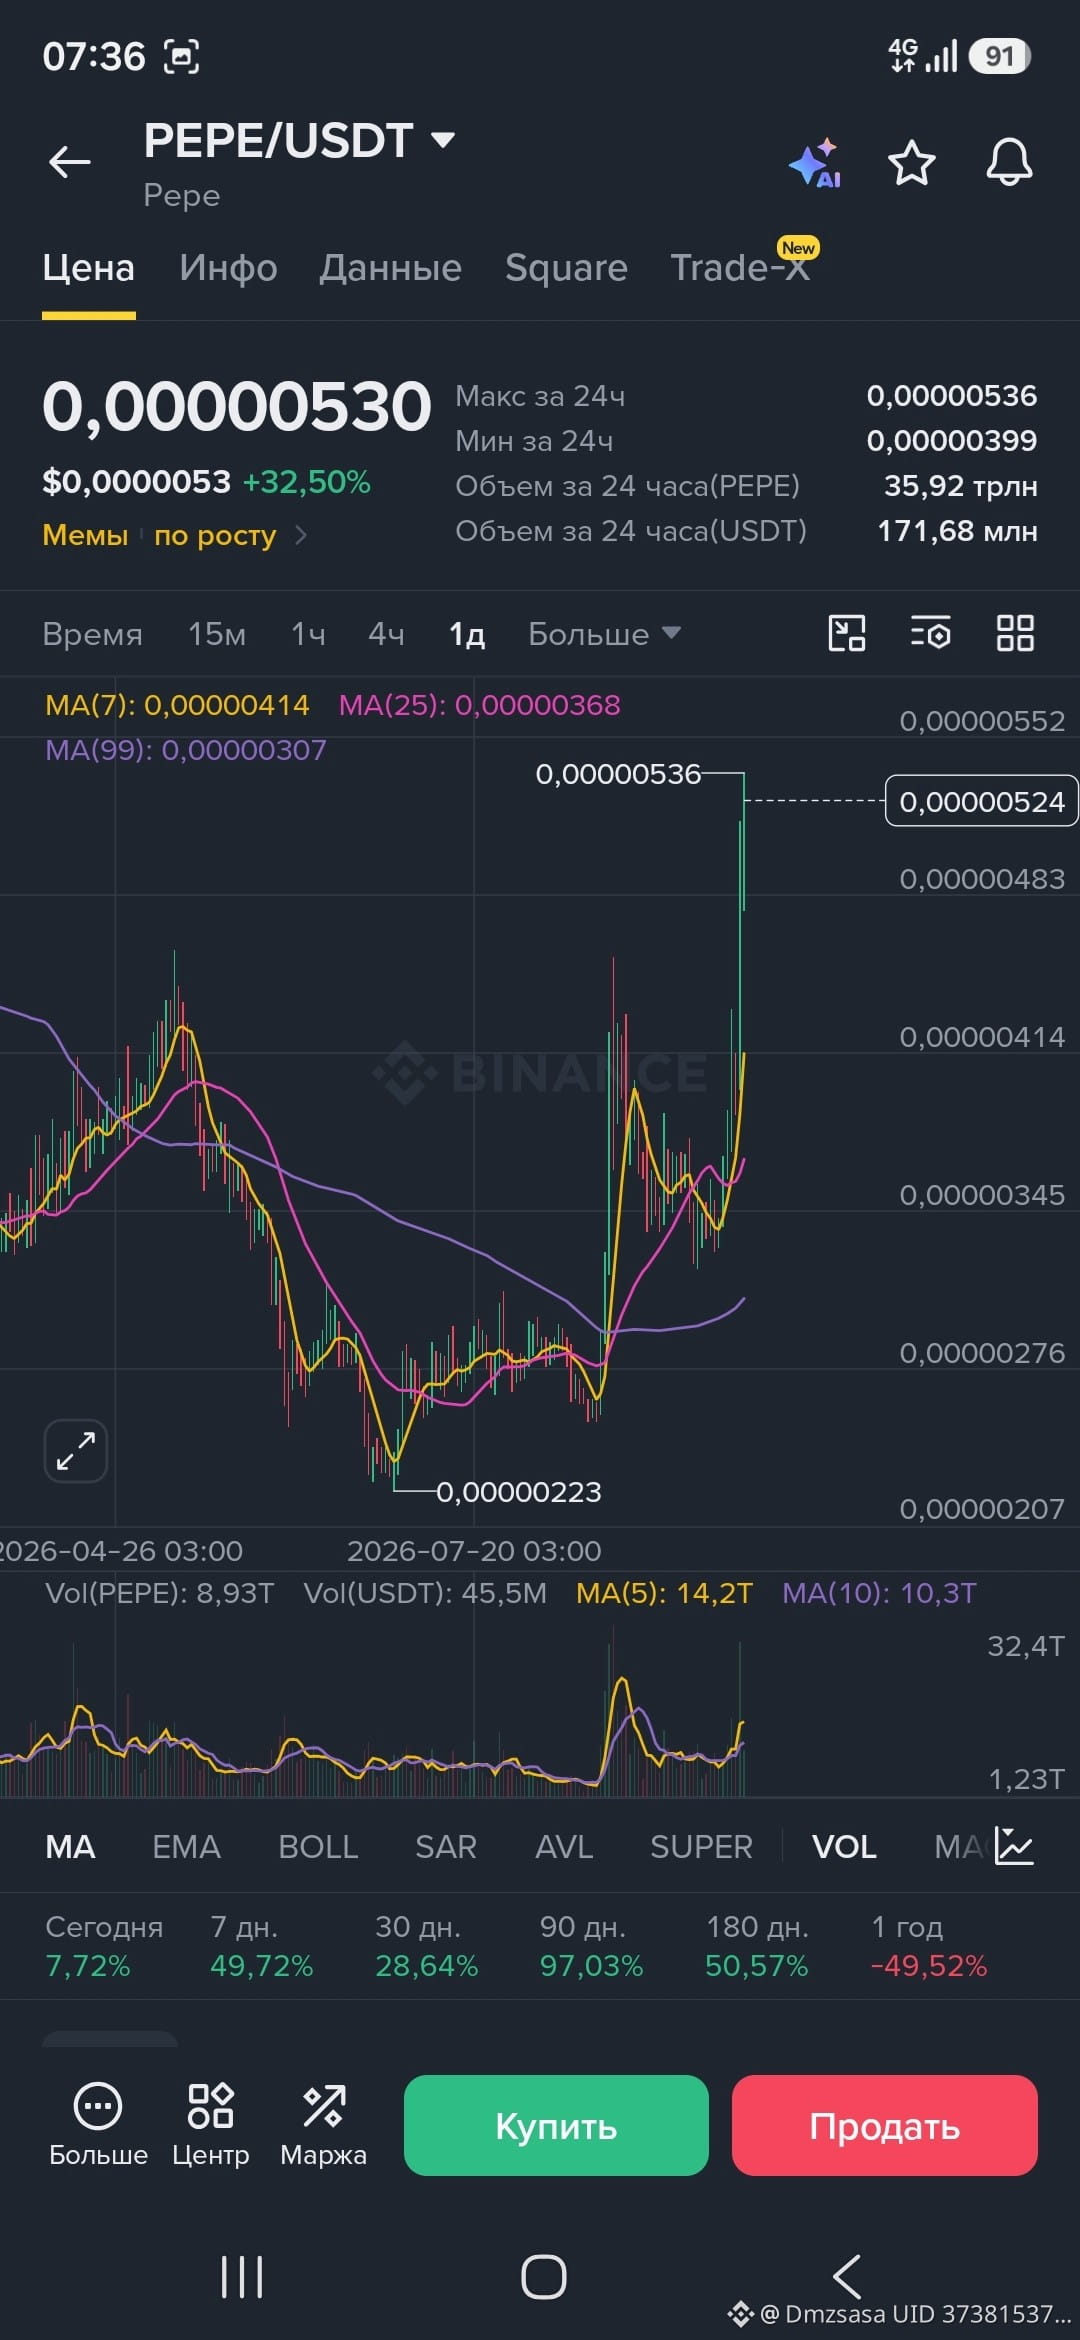
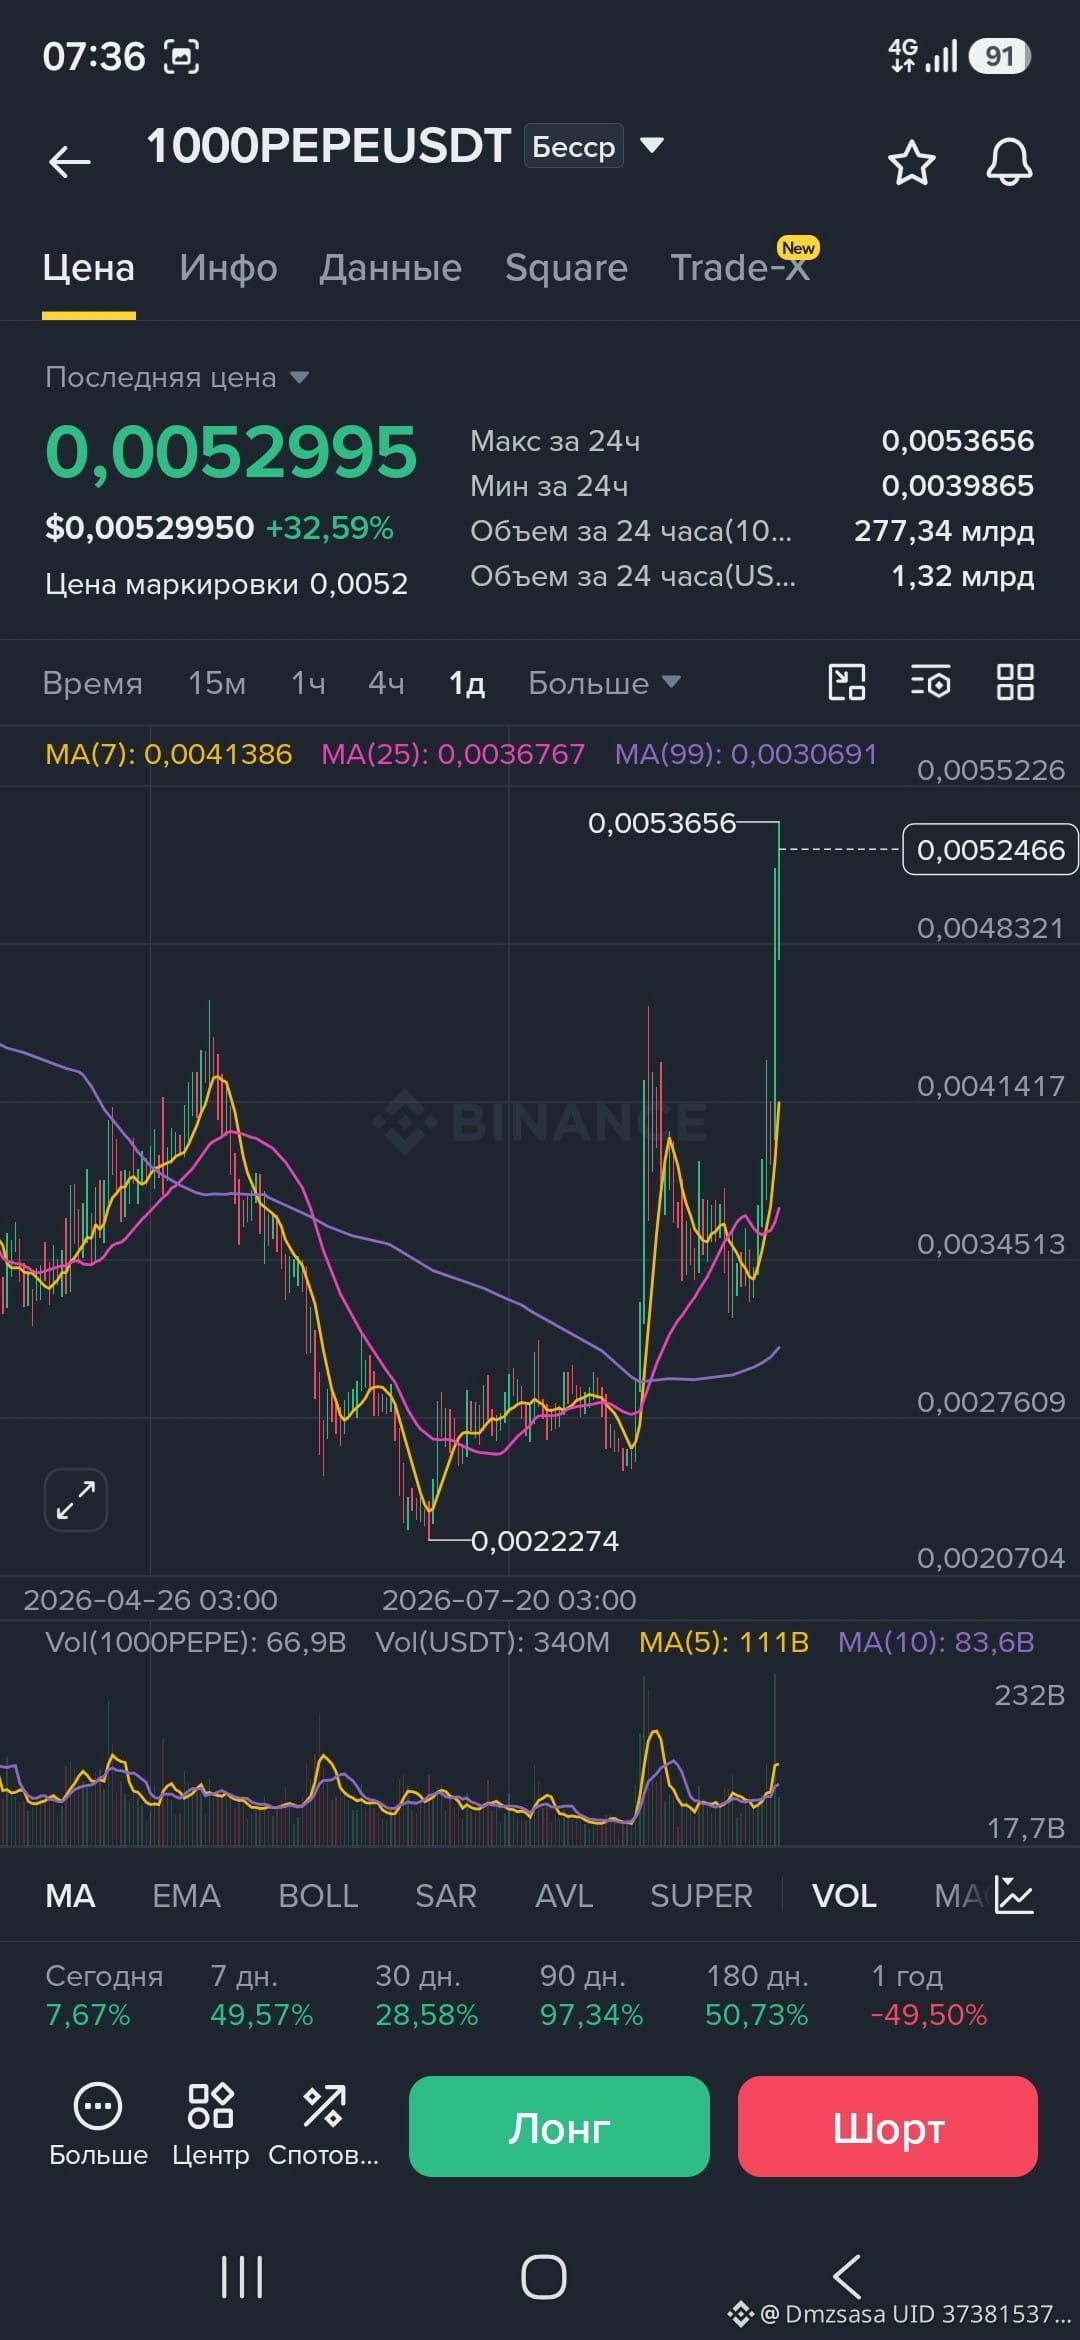
🚀 $1000PEPE / $PEPE — WE’RE BACK IN BUSINESS!
Don’t shorten PEPE! The coin is set to continue its growth. Opening a Long $1000PEPE right now!
📥 Entry: $0.0048 – $0.0052
🎯 Take-profits:
• TP1: $0.0054
• TP2: $0.0057
• TP3: $0.0061
• TP4: $0.0071
• TP5: $0.0081
🛑 Stop-loss: $0.0045
Hold the position—don’t panic during pullbacks. The goal is to consistently take the levels. Manage your risk and lock in profit in parts.
{spot}(PEPEUSDT)
{future}(1000PEPEUSDT)
🚀 $1000PEPE / $PEPE — WE’RE BACK IN BUSINESS!
Don’t shorten PEPE! The coin is set to continue its growth. Opening a Long $1000PEPE right now!
📥 Entry: $0.0048 – $0.0052
🎯 Take-profits:
• TP1: $0.0054
• TP2: $0.0057
• TP3: $0.0061
• TP4: $0.0071
• TP5: $0.0081
🛑 Stop-loss: $0.0045
Hold the position—don’t panic during pullbacks. The goal is to consistently take the levels. Manage your risk and lock in profit in parts.
Don’t shorten PEPE! The coin is set to continue its growth. Opening a Long $1000PEPE right now!
📥 Entry: $0.0048 – $0.0052
🎯 Take-profits:
• TP1: $0.0054
• TP2: $0.0057
• TP3: $0.0061
• TP4: $0.0071
• TP5: $0.0081
🛑 Stop-loss: $0.0045
Hold the position—don’t panic during pullbacks. The goal is to consistently take the levels. Manage your risk and lock in profit in parts.
1
96
·
--
Bullish
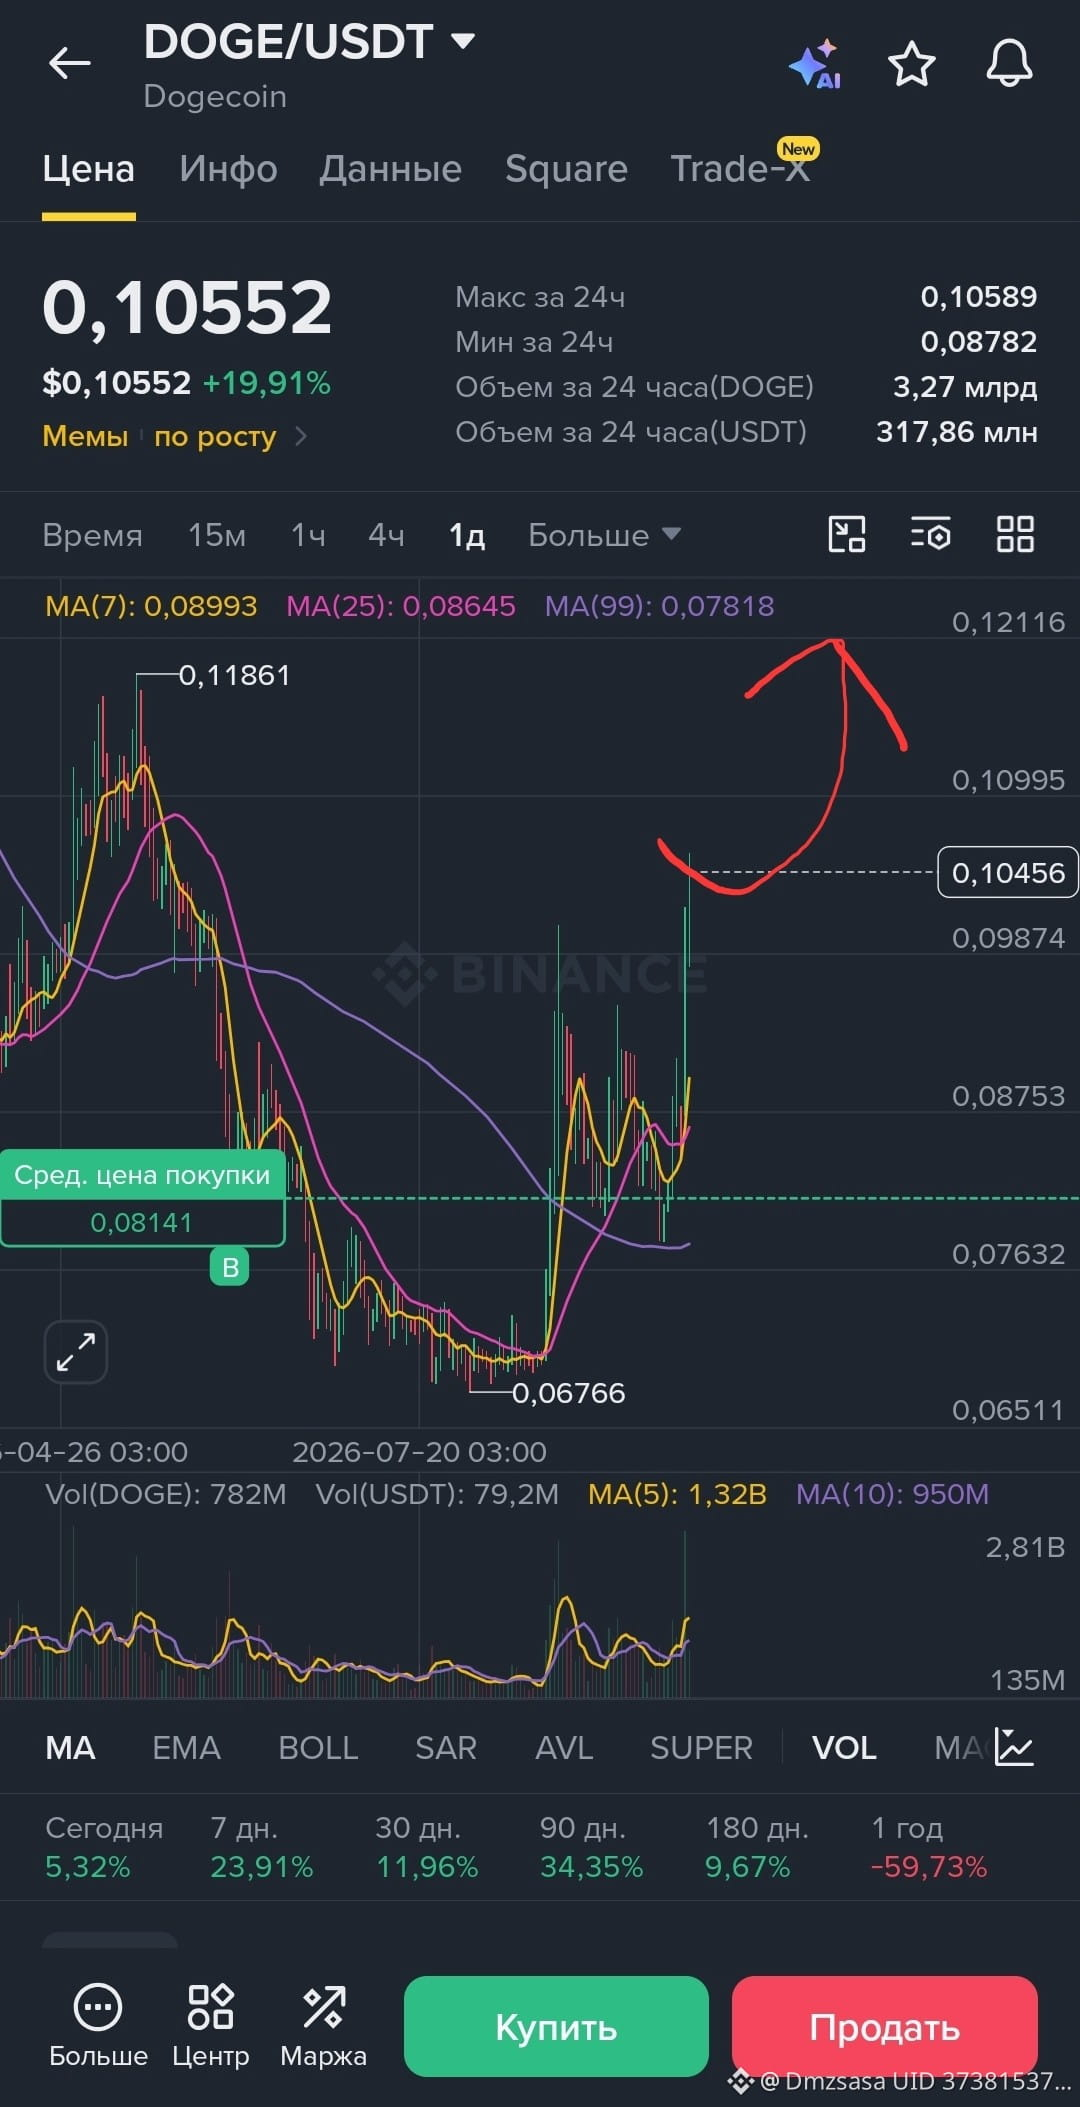
$DOGE forms a bullish flag on the daily chart. A breakout of $0.1 will open the way upward.
Text:
On the daily timeframe, Dogecoin is drawing a classic bullish pattern called a “Flag.” Buyers are increasing their dominance, and volumes are rising, which confirms accumulation strength.
Key trigger: A solid daily candlestick close above the $0.10 level activates the entire structure.
Trade parameters (Long):
• Entry: $0.105 – $0.115
• Stop-loss: $0.090 (mandatory condition)
• **Targets (Take-profit):**
• Target 1: $0.119
• Target 2: $0.165
• Target 3: $0.217
• Target 4: $0.280
{future}(DOGEUSDT)
$DOGE
$DOGE forms a bullish flag on the daily chart. A breakout of $0.1 will open the way upward.
Text:
On the daily timeframe, Dogecoin is drawing a classic bullish pattern called a “Flag.” Buyers are increasing their dominance, and volumes are rising, which confirms accumulation strength.
Key trigger: A solid daily candlestick close above the $0.10 level activates the entire structure.
Trade parameters (Long):
• Entry: $0.105 – $0.115
• Stop-loss: $0.090 (mandatory condition)
• **Targets (Take-profit):**
• Target 1: $0.119
• Target 2: $0.165
• Target 3: $0.217
• Target 4: $0.280
$DOGE
Text:
On the daily timeframe, Dogecoin is drawing a classic bullish pattern called a “Flag.” Buyers are increasing their dominance, and volumes are rising, which confirms accumulation strength.
Key trigger: A solid daily candlestick close above the $0.10 level activates the entire structure.
Trade parameters (Long):
• Entry: $0.105 – $0.115
• Stop-loss: $0.090 (mandatory condition)
• **Targets (Take-profit):**
• Target 1: $0.119
• Target 2: $0.165
• Target 3: $0.217
• Target 4: $0.280
$DOGE
61
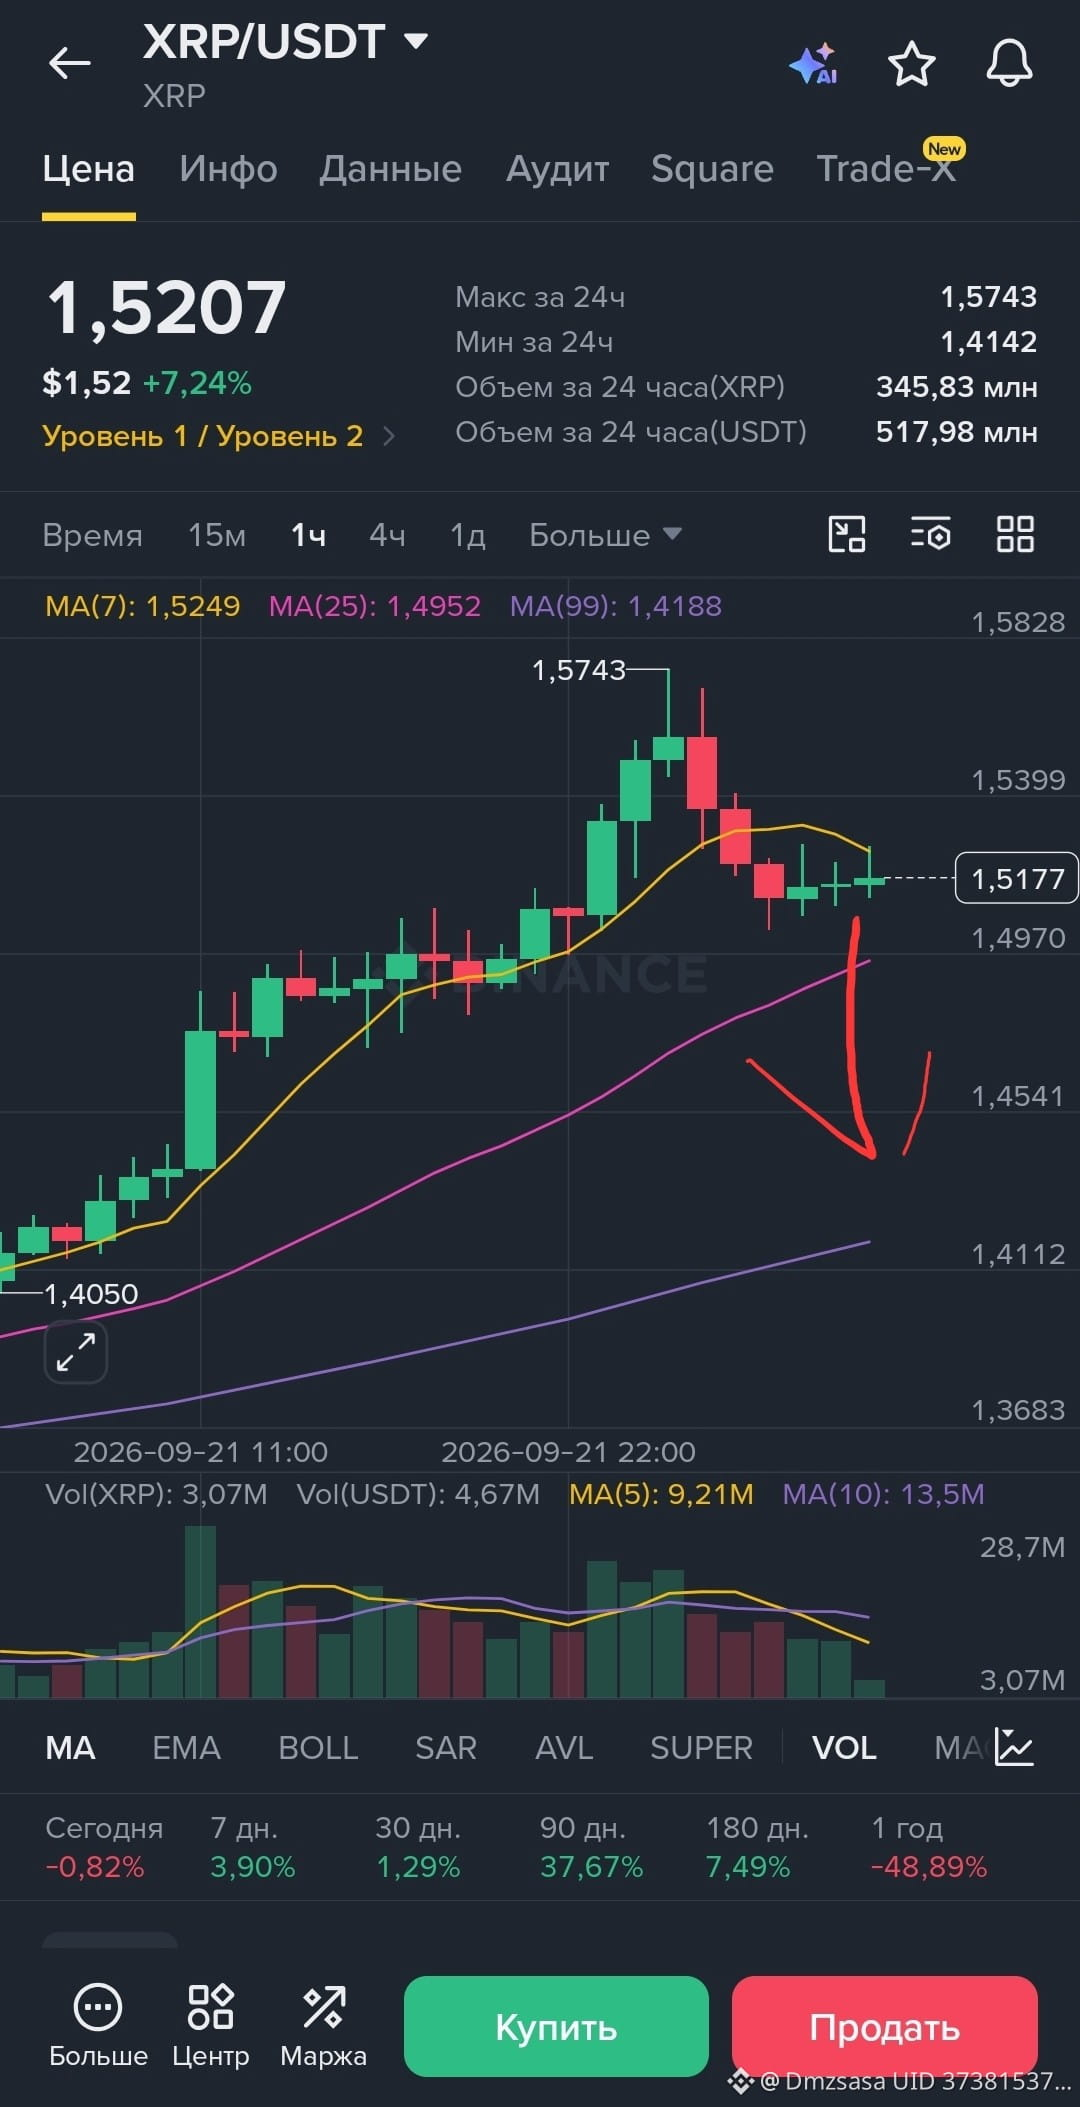
$XRP — short setup 📉
Entry: at the current price
Stop-loss: 1.59
Take-profit: 1.49 – 1.47 – 1.45 – 1.43
Logic: price has reached local resistance, the momentum is weakening, I’m waiting for a pullback to the lower levels.
Risk per trade — no more than 1–2% of the account.
Not financial advice. DYOR 👇
{future}(XRPUSDT)
$XRP
$XRP — short setup 📉
Entry: at the current price
Stop-loss: 1.59
Take-profit: 1.49 – 1.47 – 1.45 – 1.43
Logic: price has reached local resistance, the momentum is weakening, I’m waiting for a pullback to the lower levels.
Risk per trade — no more than 1–2% of the account.
Not financial advice. DYOR 👇
$XRP
Entry: at the current price
Stop-loss: 1.59
Take-profit: 1.49 – 1.47 – 1.45 – 1.43
Logic: price has reached local resistance, the momentum is weakening, I’m waiting for a pullback to the lower levels.
Risk per trade — no more than 1–2% of the account.
Not financial advice. DYOR 👇
$XRP
64
·
--
Bullish
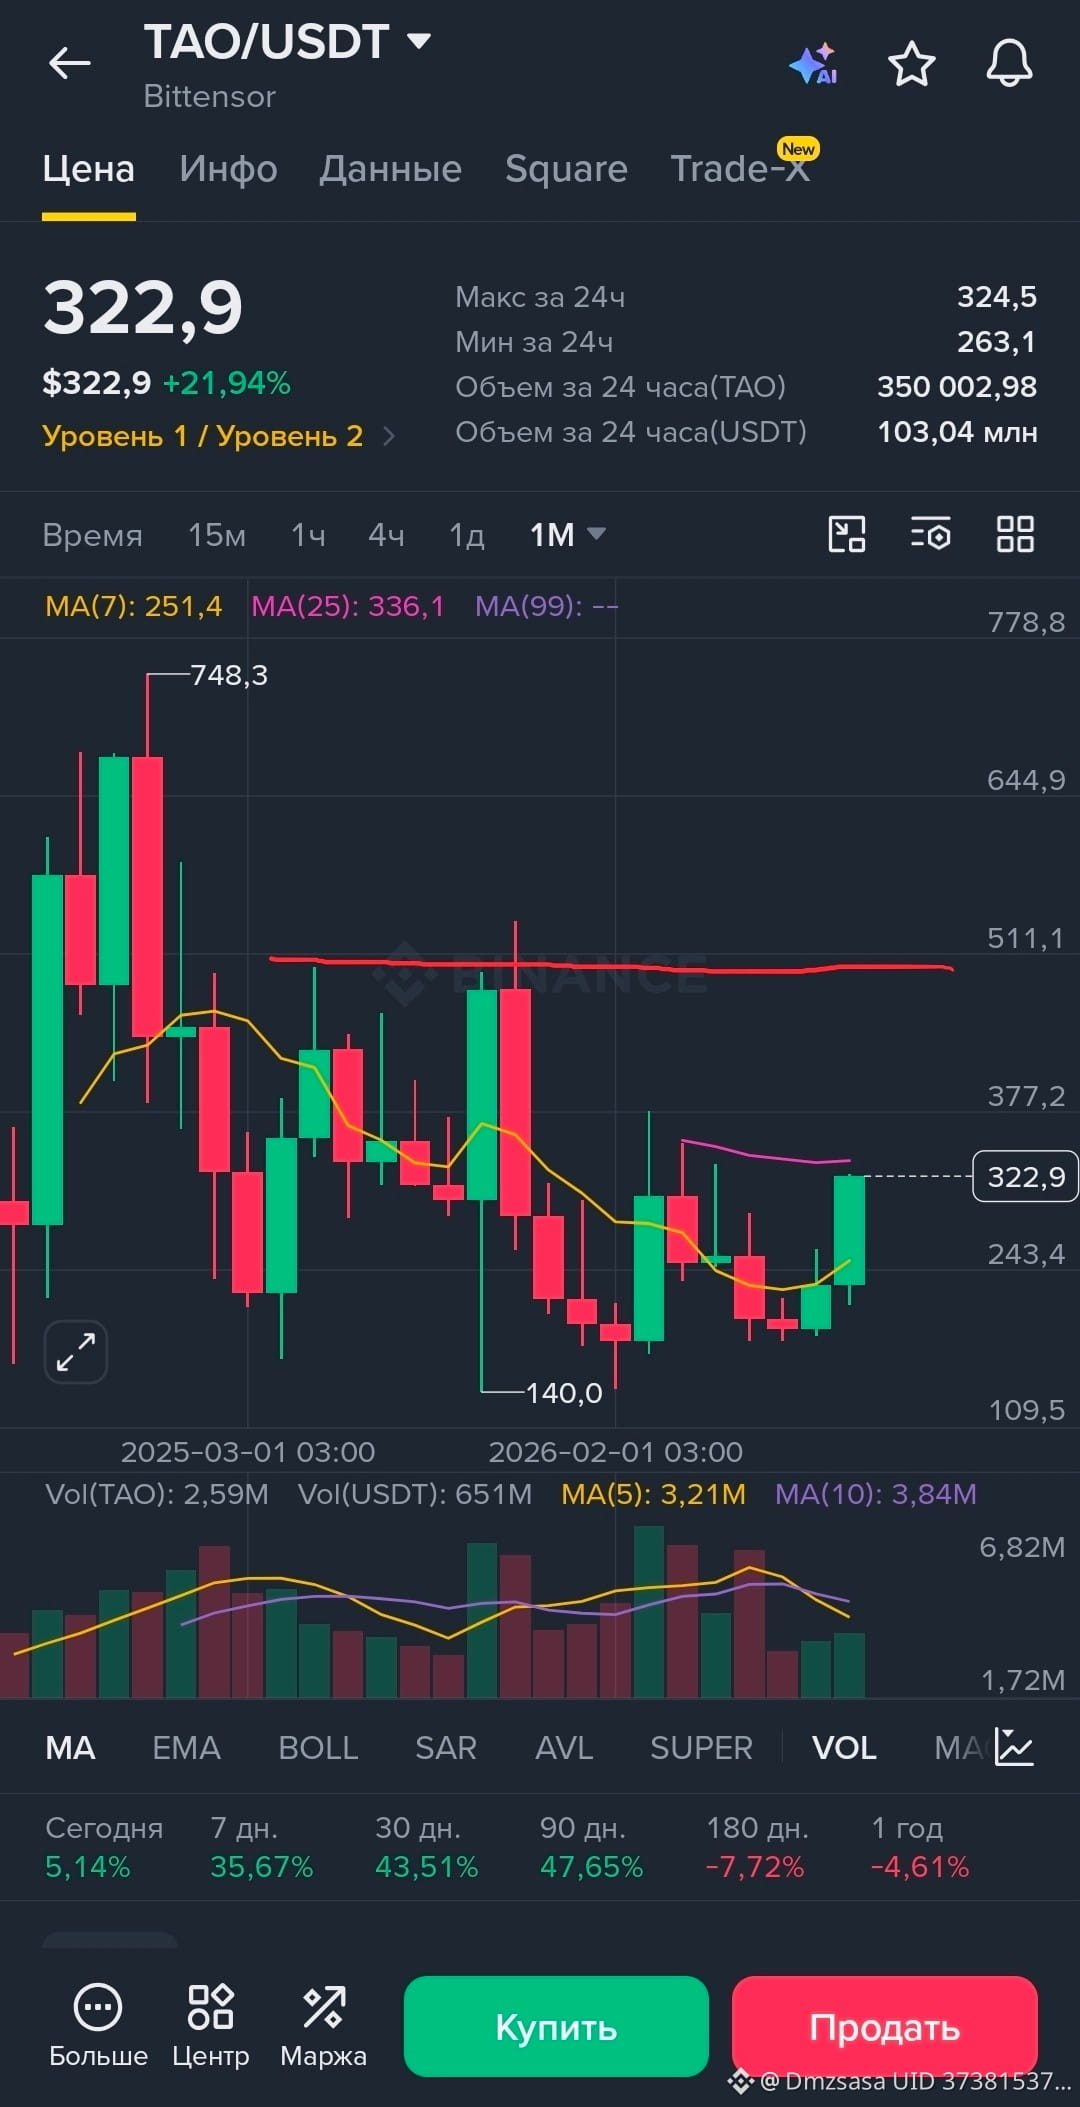
$TAO confidently breaks upward! 🚀
It seems this is only the beginning of a long journey. My target milestone in this bull cycle is $510 and above.
Opening a long right now.
📥 Entry: $315 - $325
🎯 Targets: $345 | $365 | $385 | $410 | $510
🛑 Stop: $285
{future}(TAOUSDT)
$TAO
$TAO confidently breaks upward! 🚀
It seems this is only the beginning of a long journey. My target milestone in this bull cycle is $510 and above.
Opening a long right now.
📥 Entry: $315 - $325
🎯 Targets: $345 | $365 | $385 | $410 | $510
🛑 Stop: $285
$TAO
It seems this is only the beginning of a long journey. My target milestone in this bull cycle is $510 and above.
Opening a long right now.
📥 Entry: $315 - $325
🎯 Targets: $345 | $365 | $385 | $410 | $510
🛑 Stop: $285
$TAO
1
138
·
--
Bullish
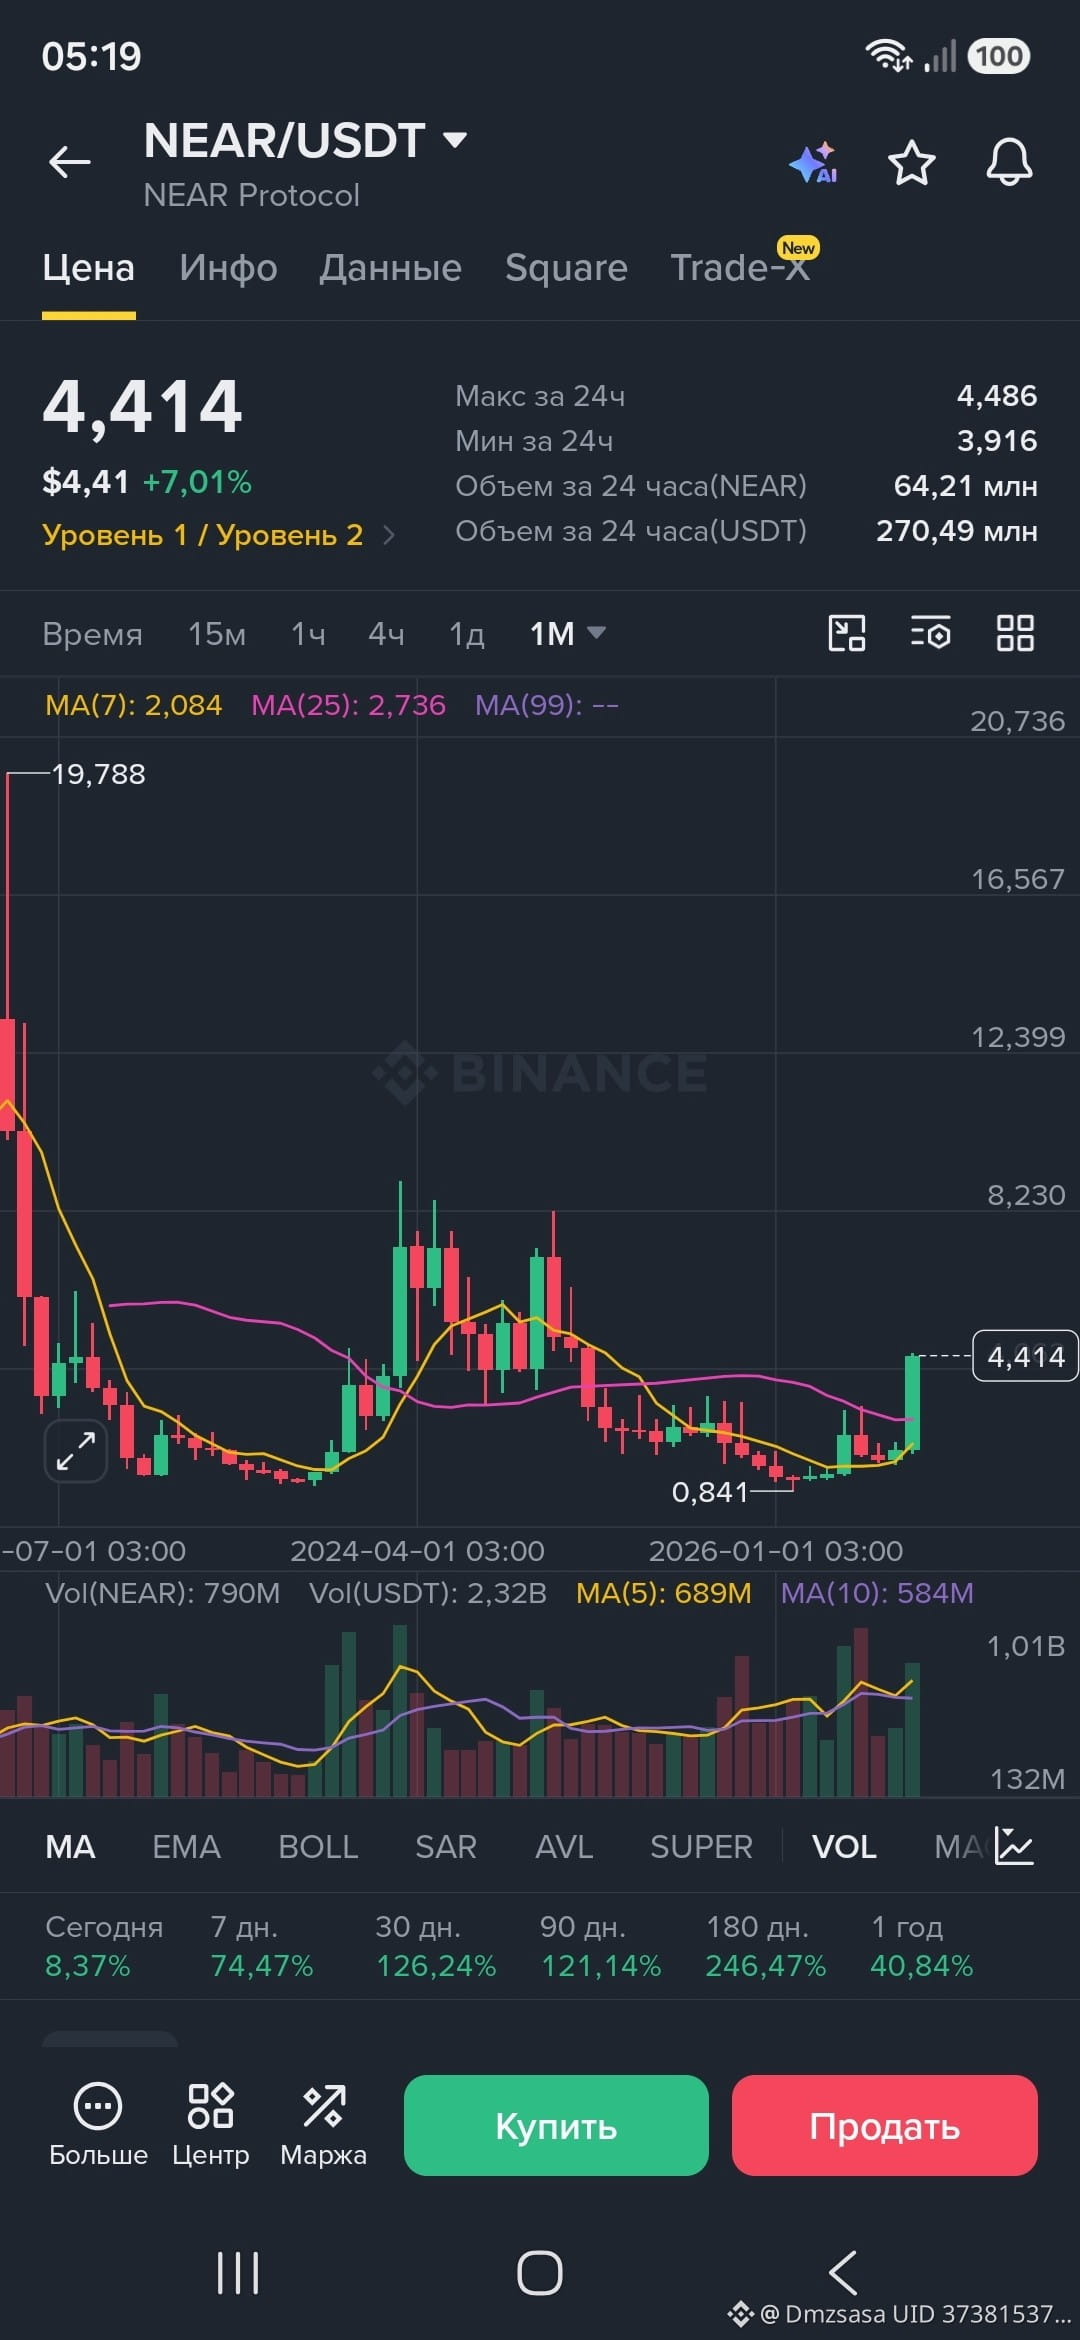
$NEAR gains momentum: goal $6! 🚀
The current NEAR momentum looks extremely strong. I don't recommend going against the trend — the market is clearly set for growth.
📈 Trade plan (Long):
🔹 Entry: $4.4 – $4.6
🎯 Targets (TP): $4.8 | $5.1 | $5.6 | $6.2
🛑 Stop-loss (SL): $3.94
The trend is our friend. We hold the position and lock in profit at the targets!
{future}(NEARUSDT)
$NEAR
$NEAR gains momentum: goal $6! 🚀
The current NEAR momentum looks extremely strong. I don't recommend going against the trend — the market is clearly set for growth.
📈 Trade plan (Long):
🔹 Entry: $4.4 – $4.6
🎯 Targets (TP): $4.8 | $5.1 | $5.6 | $6.2
🛑 Stop-loss (SL): $3.94
The trend is our friend. We hold the position and lock in profit at the targets!
$NEAR
The current NEAR momentum looks extremely strong. I don't recommend going against the trend — the market is clearly set for growth.
📈 Trade plan (Long):
🔹 Entry: $4.4 – $4.6
🎯 Targets (TP): $4.8 | $5.1 | $5.6 | $6.2
🛑 Stop-loss (SL): $3.94
The trend is our friend. We hold the position and lock in profit at the targets!
$NEAR
127
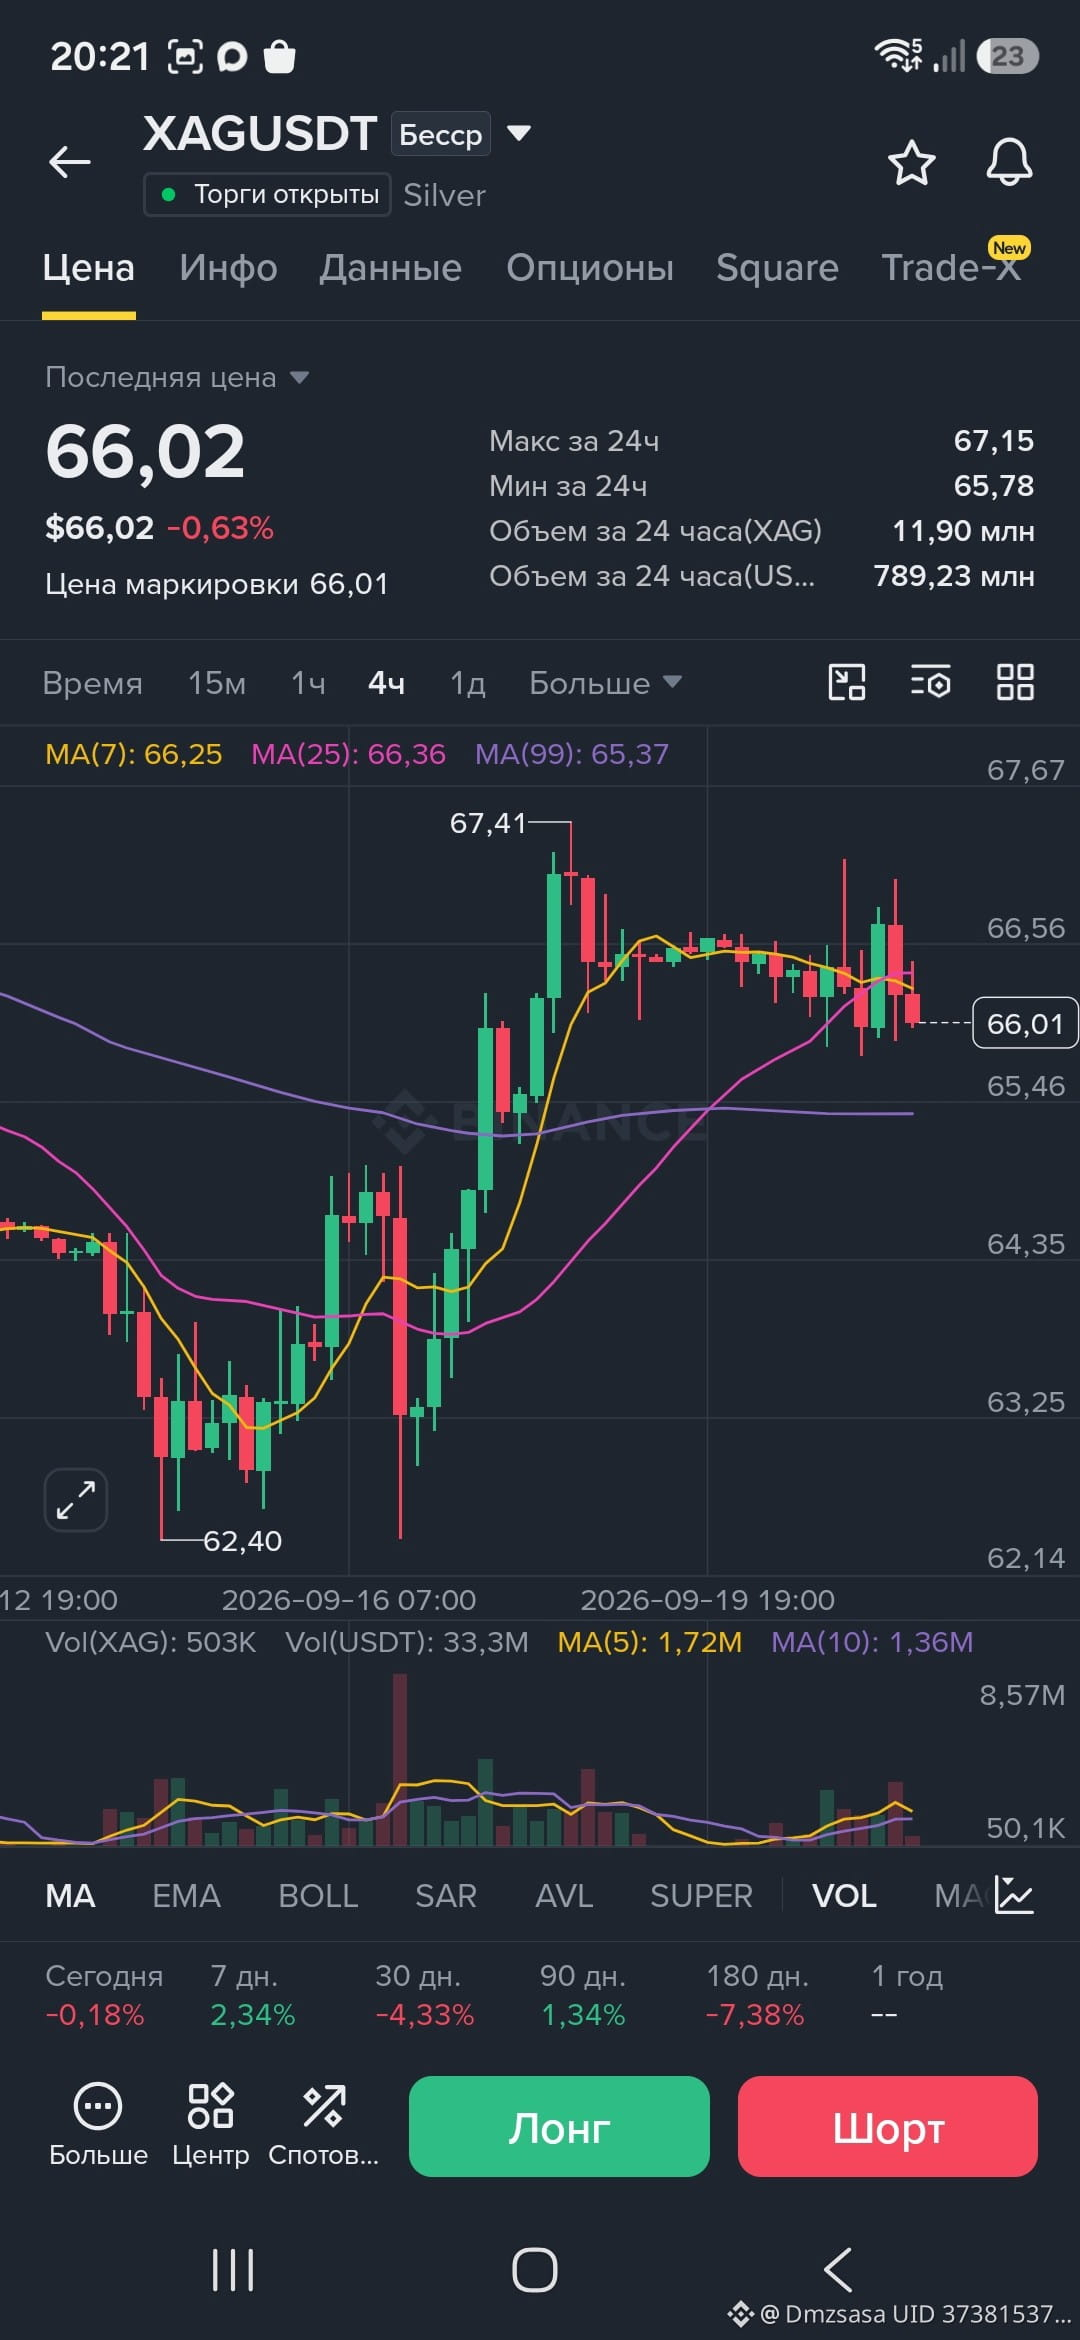
$XAG — trust and follow. I set up a big short. We earn. 💸
Stop-loss: 68
Take-profit: 62
Short $XAG now 👇
{future}(XAGUSDT)
$XAG
$XAG — trust and follow. I set up a big short. We earn. 💸
Stop-loss: 68
Take-profit: 62
Short $XAG now 👇
$XAG
Stop-loss: 68
Take-profit: 62
Short $XAG now 👇
$XAG
63
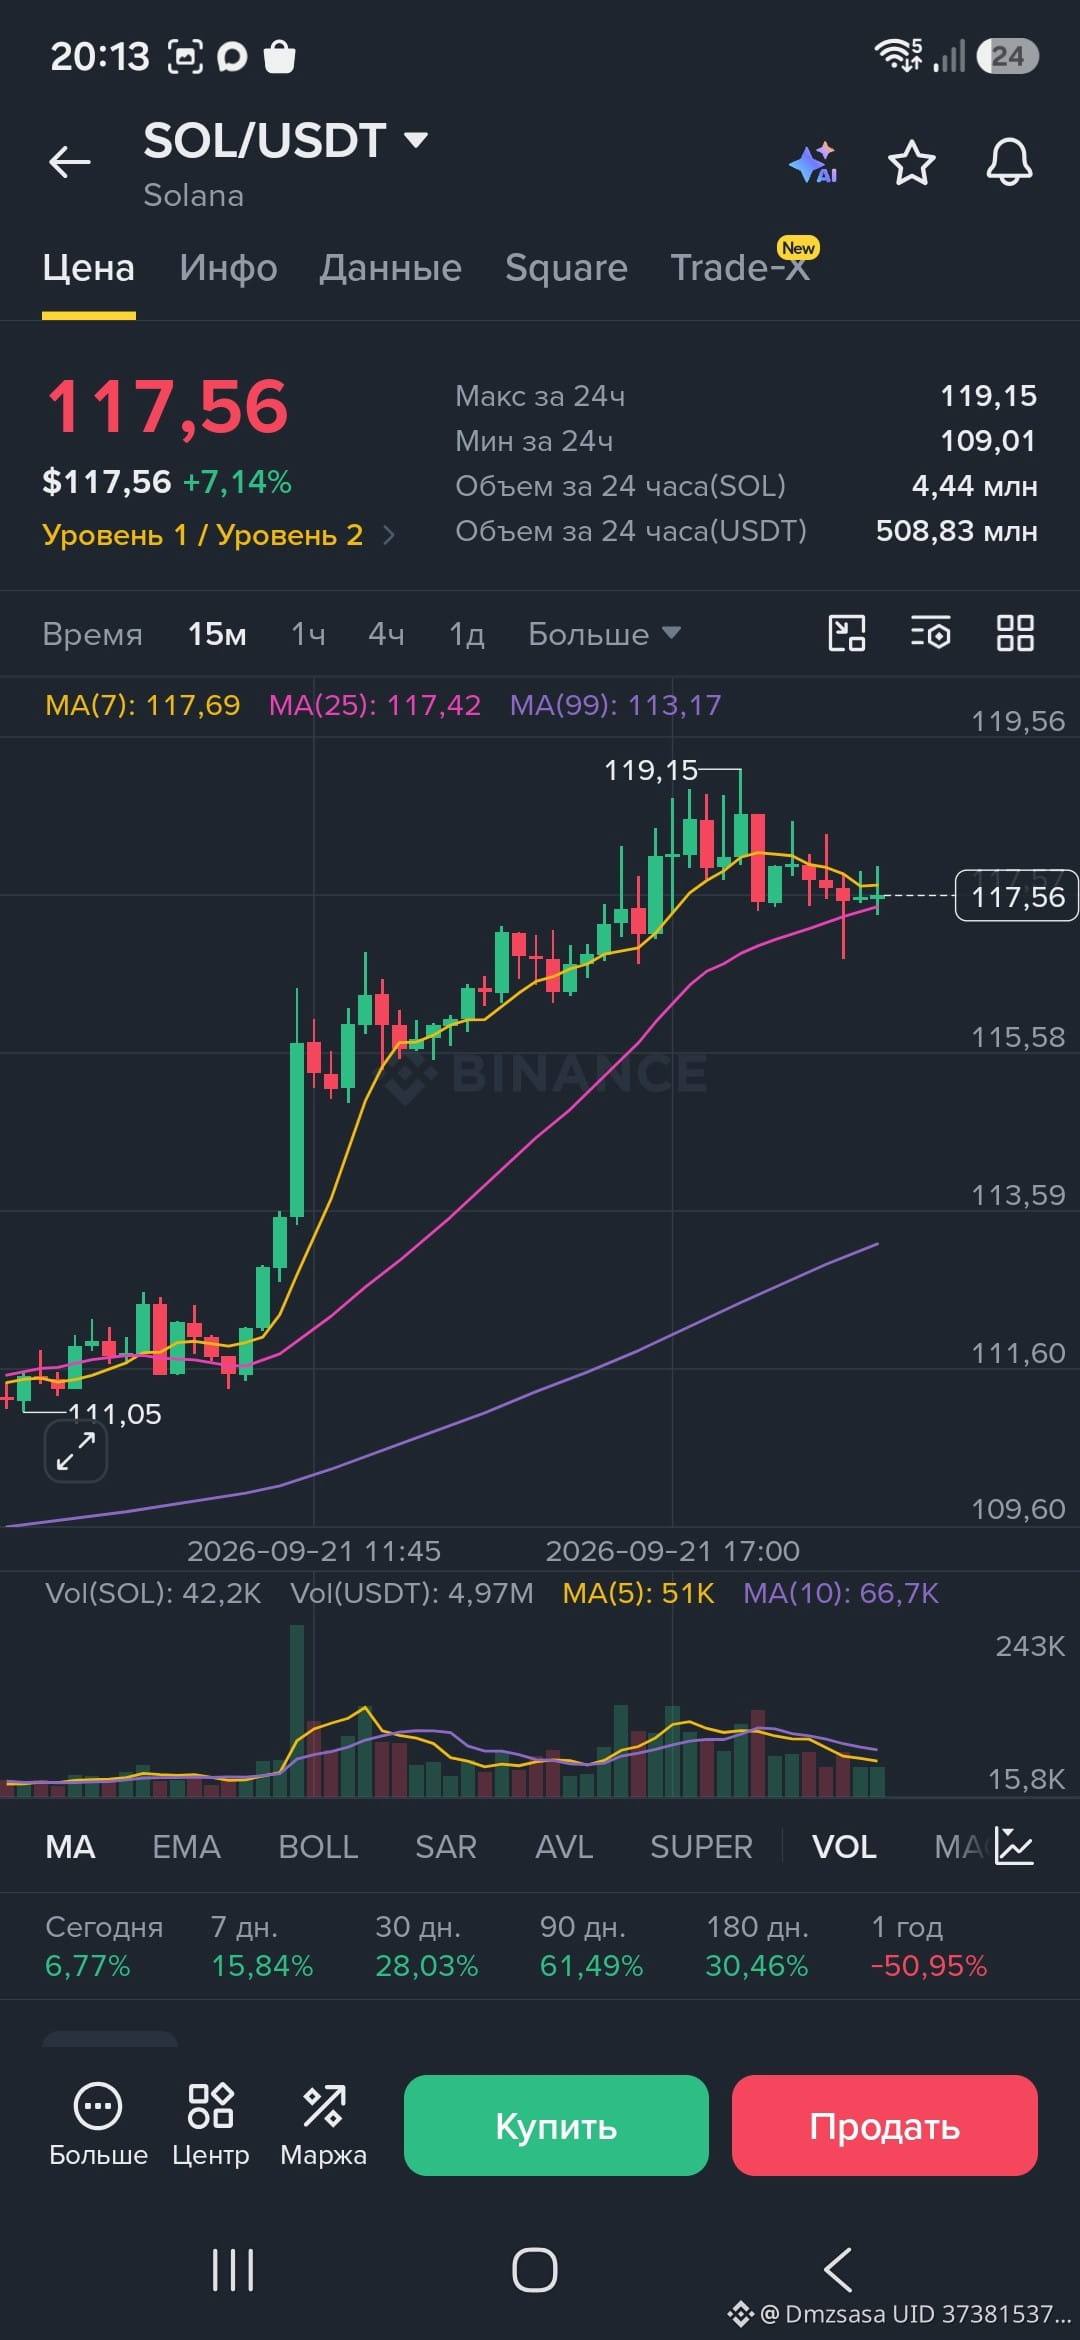
$SOL draws a mini uptrend. Entering a long.
📉 Stop-loss: 113
📈 Take-profit: 121
Entering $SOL 👇
{future}(SOLUSDT)
$SOL
$SOL draws a mini uptrend. Entering a long.
📉 Stop-loss: 113
📈 Take-profit: 121
Entering $SOL 👇
$SOL
📉 Stop-loss: 113
📈 Take-profit: 121
Entering $SOL 👇
$SOL
78
Log in to explore more content
Join global crypto users on Binance Square
⚡️ Get latest and useful information about crypto.
💬 Trusted by the world’s largest crypto exchange.
👍 Discover real insights from verified creators.
Email / Phone number
Trending Topics
CircleMints500MUSDCOnSolana
12,028 views
517 Discussing
#circlemints500musdconsolana
🚨 HUGE Liquidity Boost! Circle Mints $500 Million USDC on Solana — Is a Massive DeFi Rally Next? 🚀
💵 What Happened?
In a major on-chain event, the USDC Treasury issued $500 million in USDC directly on the Solana network across two $250M transactions.
This massive influx of real-fiat-backed capital highlights a growing appetite for stablecoins in high-speed, low-cost ecosystems.
🔑 Key Takeaways & Headlines
Fresh On-Chain Liquidity: Freshly minted USDC boosts liquidity pools across Solana-based DEXs, lending markets, and yield protocols.
$SOL
Institutional Signal: Because every USDC is backed 1:1 by real reserves, large minting events reflect actual institutional or commercial capital entering the ecosystem.
Solana’s Market Share Expansion: Solana continues to capture an increasing share of total USDC circulation, threatening traditional stablecoin market distributions.
Macro & Fed Context: As traders monitor global macroeconomic developments and interest rate outlooks, high-yield on-chain opportunities attract resting capital back to Web3.
💡 Why It Matters for Traders
Lower Slippage & Better Swaps: Higher stablecoin depth means larger trades can occur without heavy market impact.
DeFi Yield Potential: Increased USDC reserves encourage higher TVL (Total Value Locked) in Solana lending and farming protocols.
Sentiment Shift: Massive stablecoin injections are historically bullish indicators for ecosystem tokens ($SOL,$JUP, $RAY,$KMNO).
What’s your play? Are you keeping cash on the sidelines or riding the Solana liquidity wave? Drop your thoughts below! 👇
#BlackRockBuildsTokenizedPortfoliosForOndo #solana #defi
Lily星星
·4 Likes
·2.2k views
PolymarketBankFailureBetsDrawFDICConcern
28,410 views
714 Discussing
BlackRockBuildsTokenizedPortfoliosForOndo
22,479 views
489 Discussing