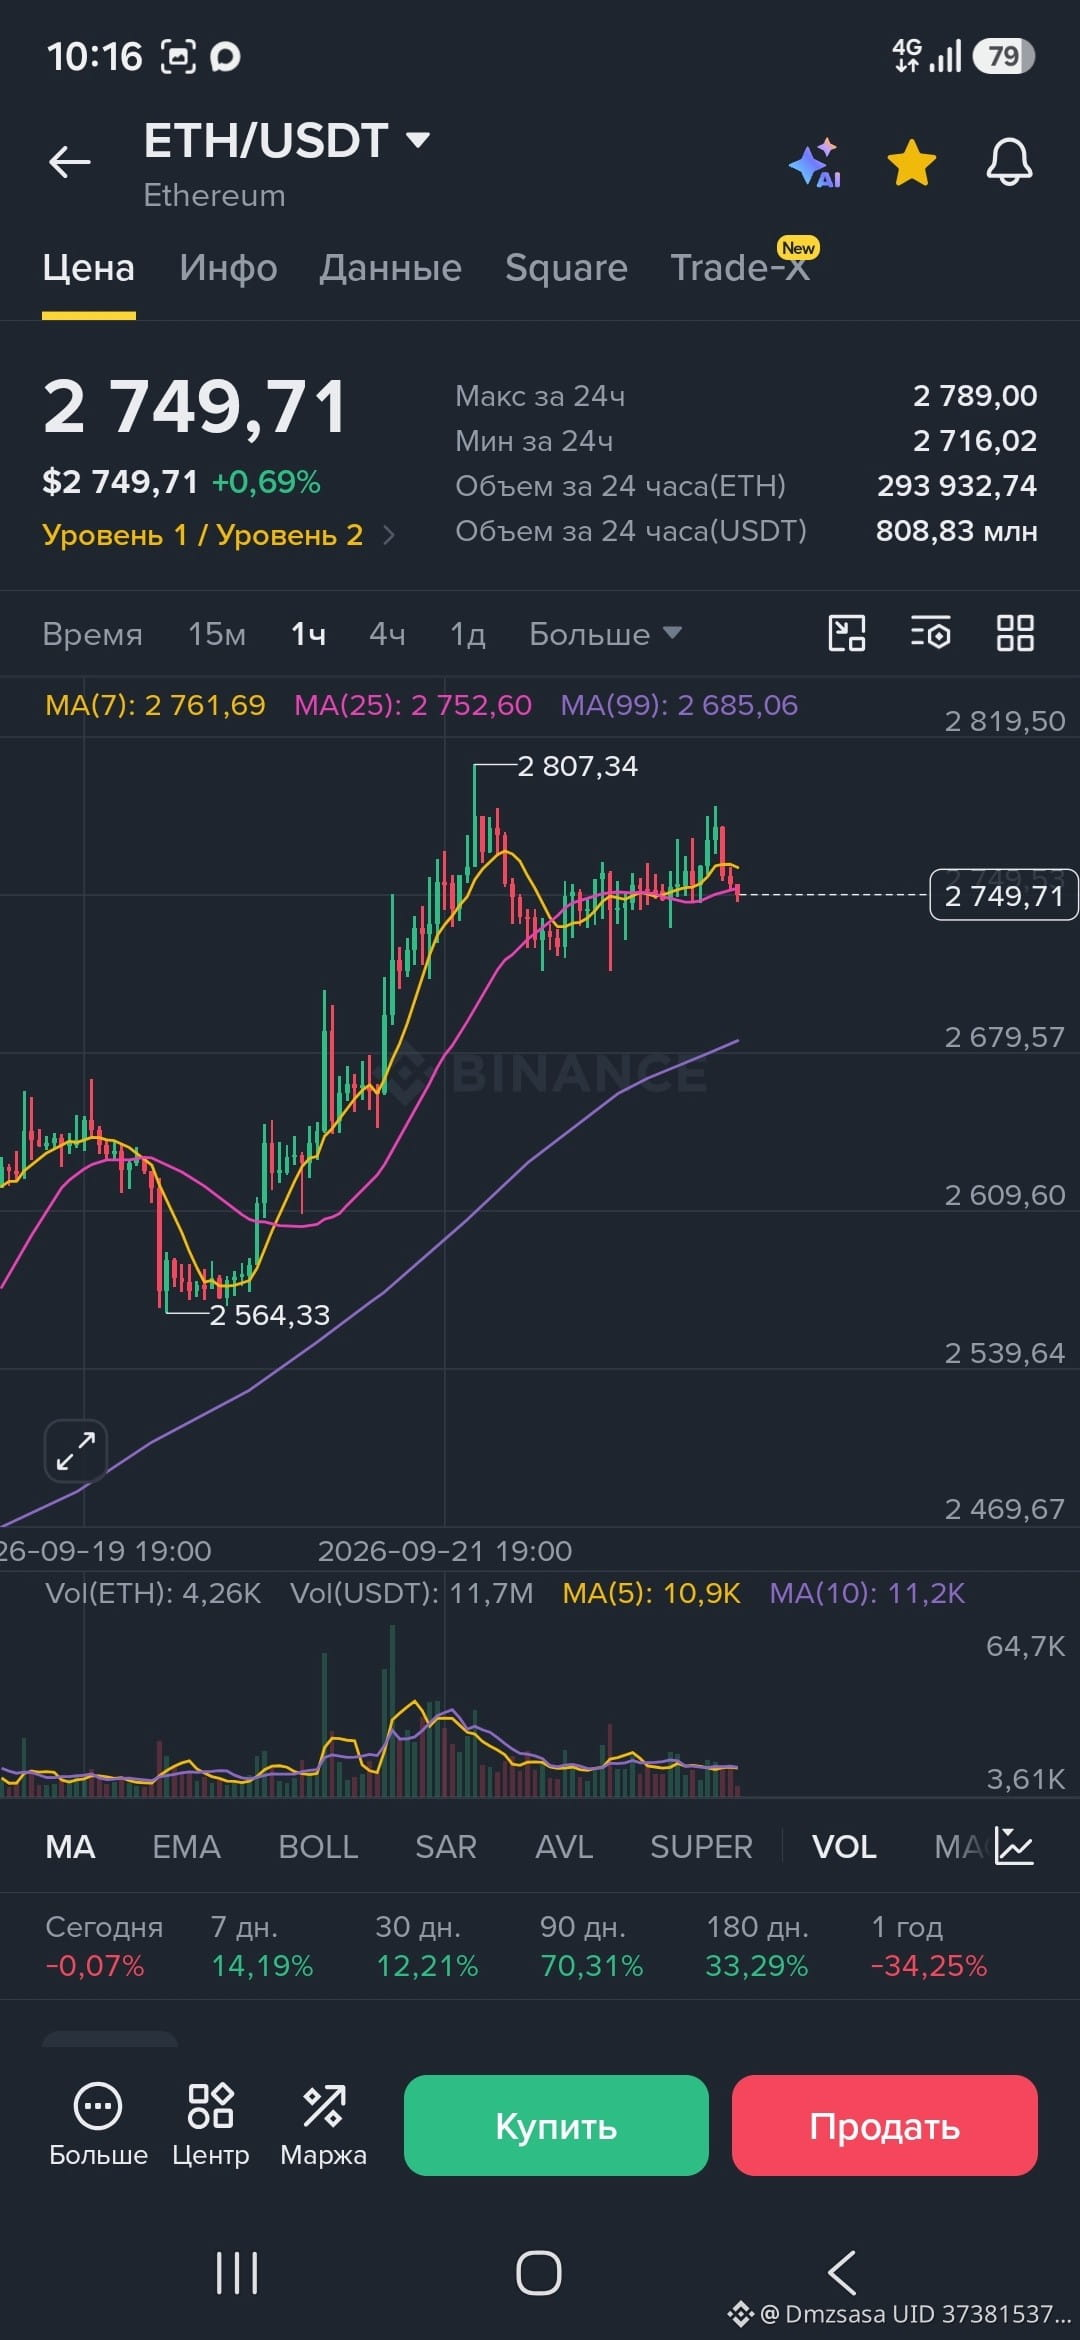
$ETH — The hourly chart shows compression. What’s next?
I’m looking at ETH/USDT on the 1-hour timeframe. After bouncing off 2,564.33, the price moved into a tight range and is now trading around 2,749.71, with a 24-hour change of just +0.69%.
What we see on the hour:
• MA(7) = 2,761.69 and MA(25) = 2,752.60 — the lines are almost stuck together. This is a sign of volatility compression, which is usually followed by an impulse.
• MA(99) = 2,685.06 — the long-term average is lower and rising. This is support in case of a deeper pullback.
• Volumes: 808.83M USDT over 24h, but on the hourly candles activity seems to be fading — the market is building a position.
Key levels on the hour:
• Resistance: 2,789 (24h high), then 2,807.34 (local peak).
• Support: 2,716.02 (24h low); below that is 2,679 (MA99 zone).
My plan:
• Break above 2,789 with rising volume → target 2,807, then 2,850+.
• Lose 2,716 → I’ll wait for a test of 2,679, and then watch the reaction there.
Coin stats: over 90 days +70.31%, over a year -34.25%. This looks like a recovery phase, and the current pause seems more like accumulation than a reversal.
Personally, I’m waiting for confirmation at 2,789. I won’t enter without volume.
How do you read the ETH hourly chart — up, or is there still more downside? $ETH #Ethereum #crypto #трейдинг
$ETH
I’m looking at ETH/USDT on the 1-hour timeframe. After bouncing off 2,564.33, the price moved into a tight range and is now trading around 2,749.71, with a 24-hour change of just +0.69%.
What we see on the hour:
• MA(7) = 2,761.69 and MA(25) = 2,752.60 — the lines are almost stuck together. This is a sign of volatility compression, which is usually followed by an impulse.
• MA(99) = 2,685.06 — the long-term average is lower and rising. This is support in case of a deeper pullback.
• Volumes: 808.83M USDT over 24h, but on the hourly candles activity seems to be fading — the market is building a position.
Key levels on the hour:
• Resistance: 2,789 (24h high), then 2,807.34 (local peak).
• Support: 2,716.02 (24h low); below that is 2,679 (MA99 zone).
My plan:
• Break above 2,789 with rising volume → target 2,807, then 2,850+.
• Lose 2,716 → I’ll wait for a test of 2,679, and then watch the reaction there.
Coin stats: over 90 days +70.31%, over a year -34.25%. This looks like a recovery phase, and the current pause seems more like accumulation than a reversal.
Personally, I’m waiting for confirmation at 2,789. I won’t enter without volume.
How do you read the ETH hourly chart — up, or is there still more downside? $ETH #Ethereum #crypto #трейдинг
$ETH