



A possible weekly bullish signal could emerge next week if XRP maintains its rising structure and momentum indicators turn higher.
XRP is range-bound around recent lows, with buyers consolidating at $1.38 and sellers continuing to show up at $1.40-$1.41.
XRP Ledger activity shows larger transfer values despite fewer active accounts, pointing to changing network participation patterns.
XRP weekly setup points toward a possible bullish signal, as the recent correction appears complete and the broader rising structure remains intact on the weekly chart for now.
Weekly Structure Shows Signs of Another Advance
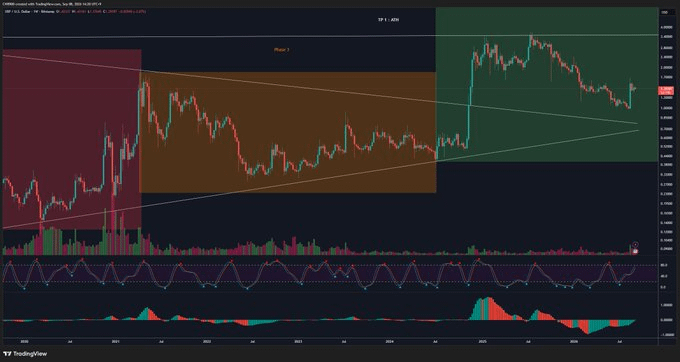
The weekly chart shows XRP moving through recurring rally and consolidation phases. Earlier advances were followed by extended corrections and sideways trading. Those formations later resolved higher across previous cycles.
 Source: X
CW said a bullish signal could emerge around next week on XRP's weekly chart. The analysis describes the recent correction as complete. It also indicates another rally may already be developing.
The latest structure follows a prolonged consolidation period before an upside breakout. Price then moved into the green area shown on the chart. The current pullback remains inside the broader rising formation.
The ascending lower trendline remains an important reference for this structure. A break below that trendline would weaken the current setup. Meanwhile, momentum indicators would need to turn higher for confirmation.
XRP Price Remains Within a Narrow Trading Range
XRP as of writing trades around $1.39, down 0.96% over 24 hours in the displayed data. Price has repeatedly moved between approximately $1.38 and $1.40. Earlier trading began near $1.41 before a sharp decline toward $1.37.
The recovery from $1.37 has remained uneven during the displayed period. Several attempts toward $1.40 failed to produce sustained upside movement. As a result, sellers continue appearing near the upper range.
Another decline pushed XRP toward $1.38 before buyers returned. Price subsequently recovered toward $1.40 before retreating again. The pattern continues to show competing pressure around both range boundaries.
The trading volume is about $2.04 billion and its market capitalization is close to $87.39 billion. Trading volume fell 3.61% whereas the volume-to-market-cap ratio stood at 2.38%. $1.40 is a key resistance level and if the price moves above that, the short-term structure would become more favorable.
Historical Cycles and Ledger Activity Add Context
The charts compare the current formation with earlier XRP consolidation phases. Those historical structures also followed extended sideways periods before upward expansion. The comparison places the present setup within a longer recurring market pattern.
TP1 represents XRP's previous all-time high on the projected chart. A move toward that level would mark the first major test. TP2 appears considerably higher and remains a future objective.
The lower indicators show repeated cycles of stronger and weaker momentum. Recent positive readings weakened during the correction from higher levels. A renewed histogram expansion could accompany the expected bullish signal.
Meanwhile, Crypto.Andy's data shows fewer active accounts than one year earlier. However, transferred value has increased, alongside larger average transaction sizes. The figures therefore show changing network activity rather than one uniform adoption trend.