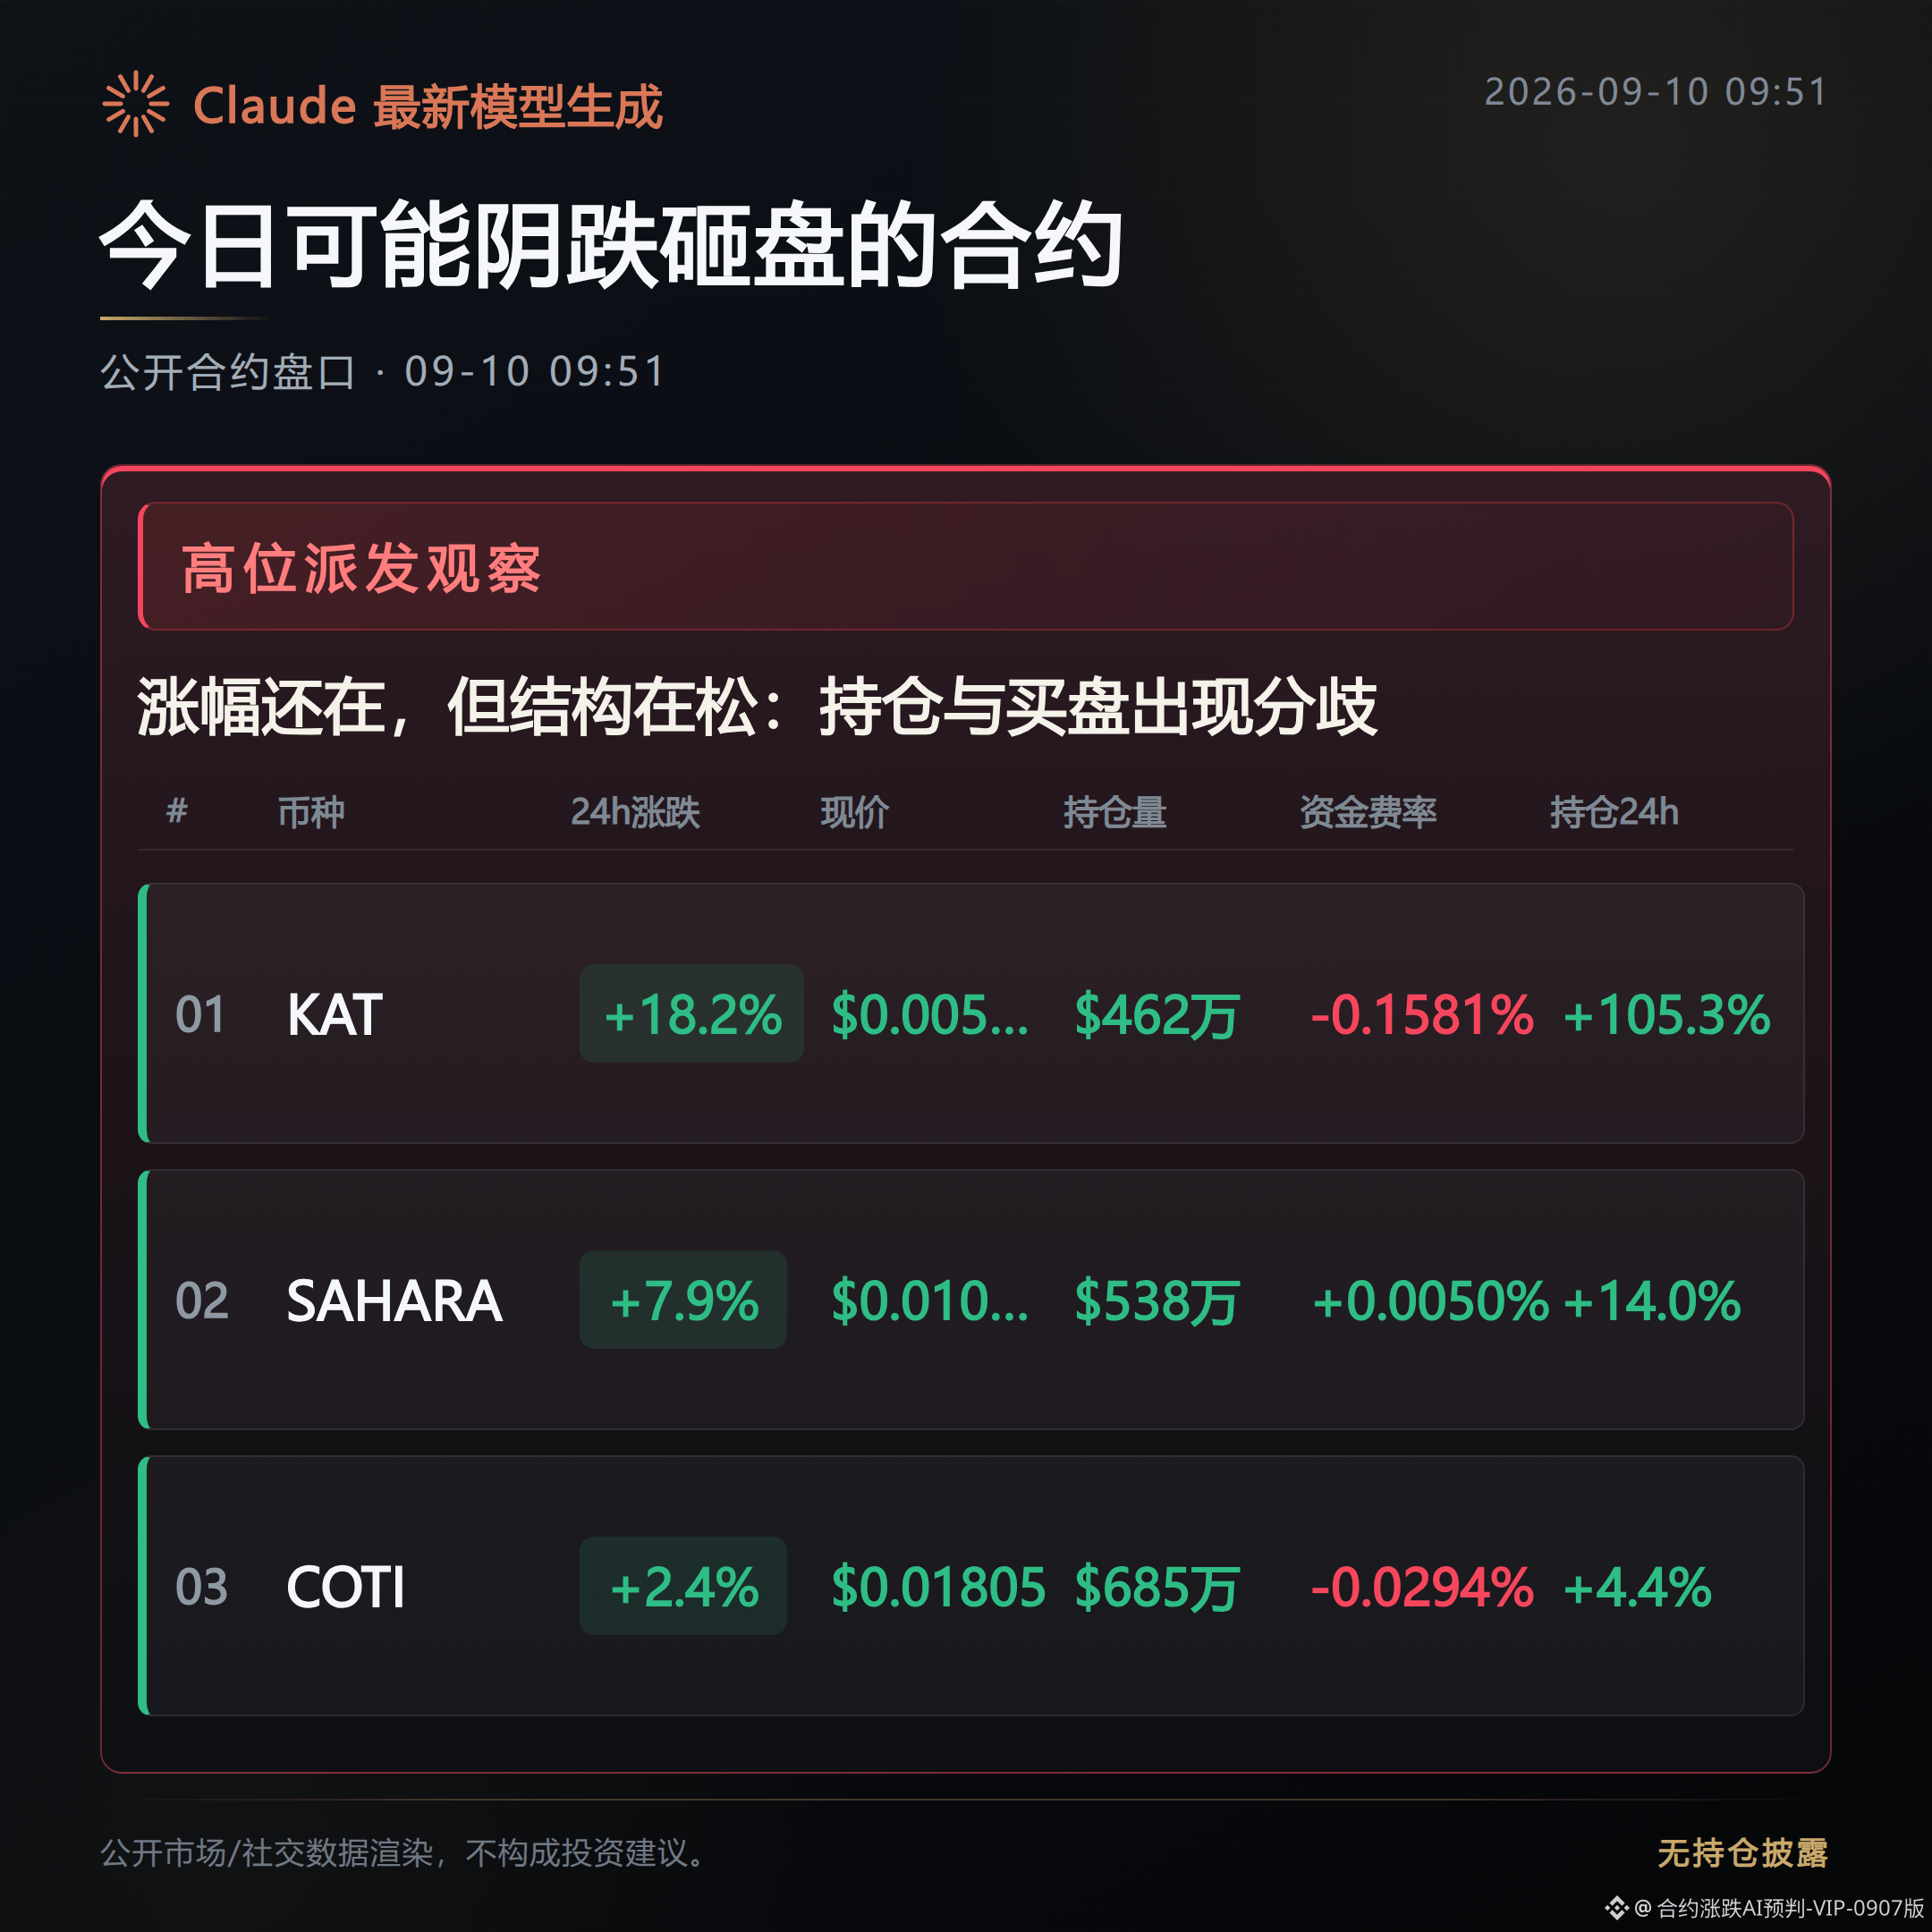

Bearish signals are increasing. Although the prices of these contracts are still climbing, the structure has started to loosen—don’t just look at the bullish percentage.
What you fear isn’t that it won’t rise, but that as it rises, the bids/acceptance will thin out. What to watch next is whether the pullback truly begins.
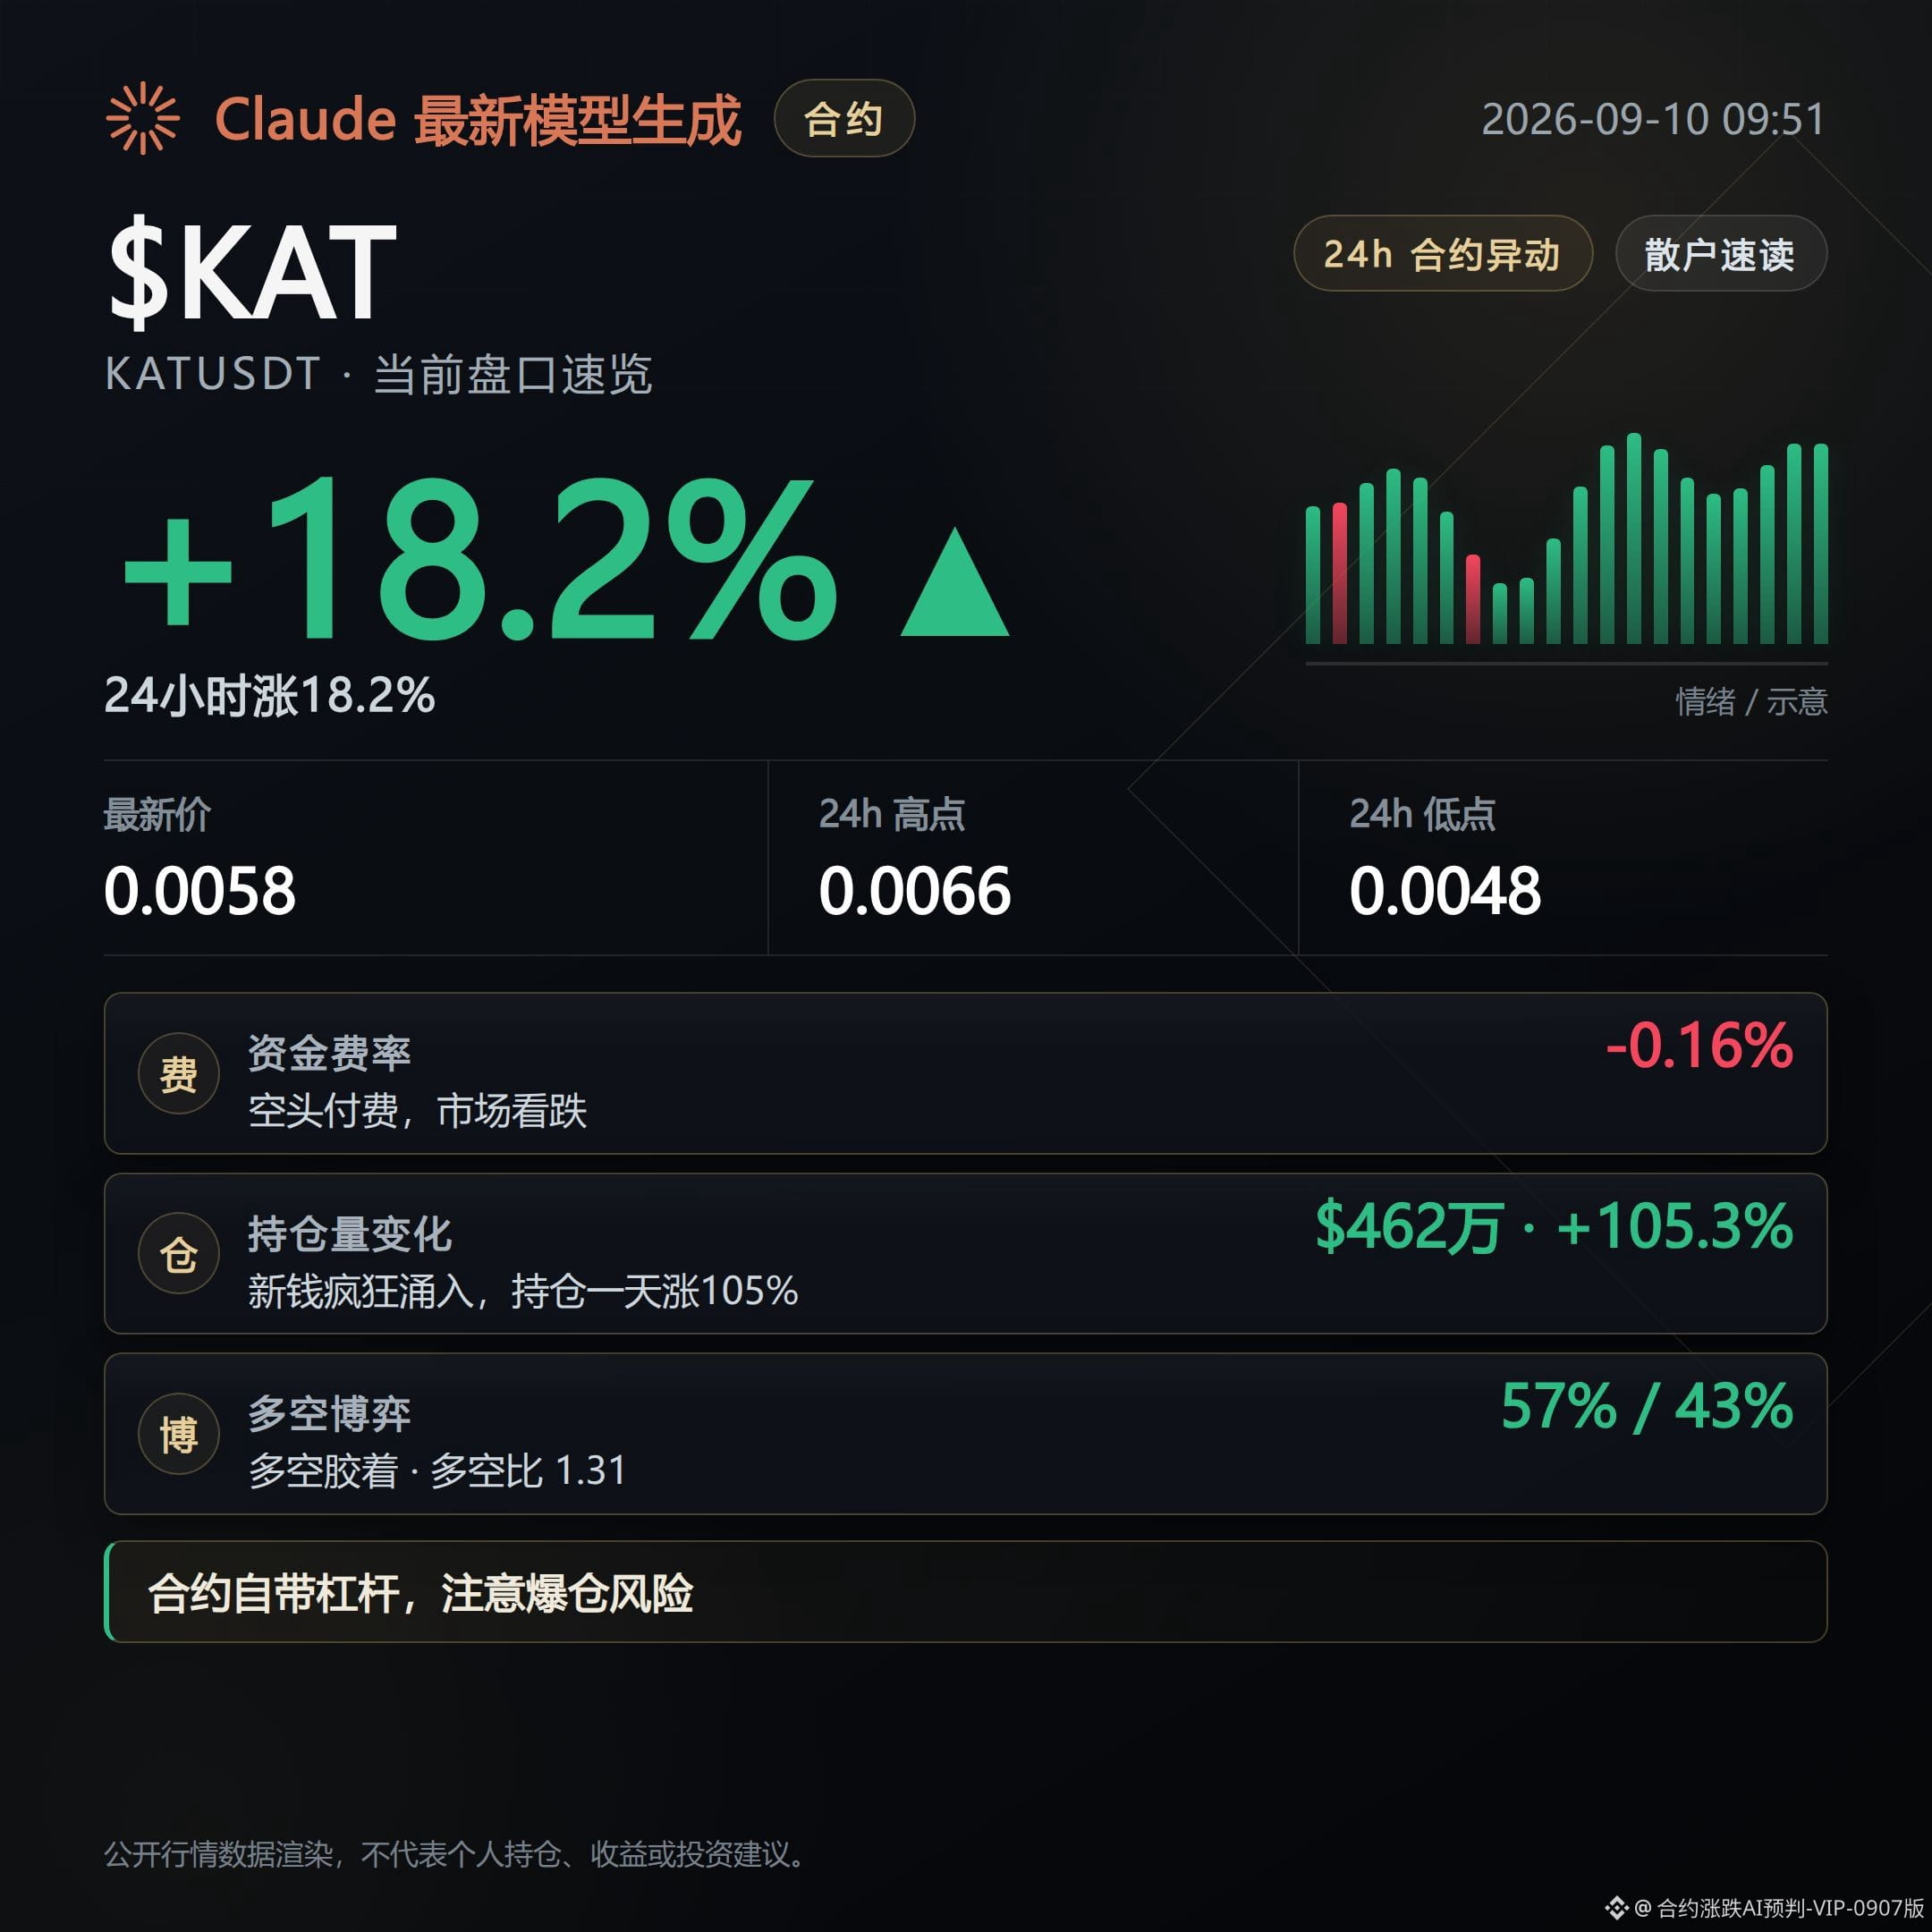
KATUSDT current price 0.005751, up 18.24% in 24 hours. It looks pretty strong, but the funding rate has paid short positions for 5 consecutive periods, and open interest has surged 105.3% in 24 hours. Yet in the 1-hour timeframe it has already flipped negative by 2.8%. Positions have flowed in, but while the price is still up, the structure is loosening. Chasing longs at higher levels can leave you getting hit by both a snapback and a pullback at the same time. The counter-evidence is that the Supertrend indicator is still moving upward, so the direction hasn’t broken down completely.
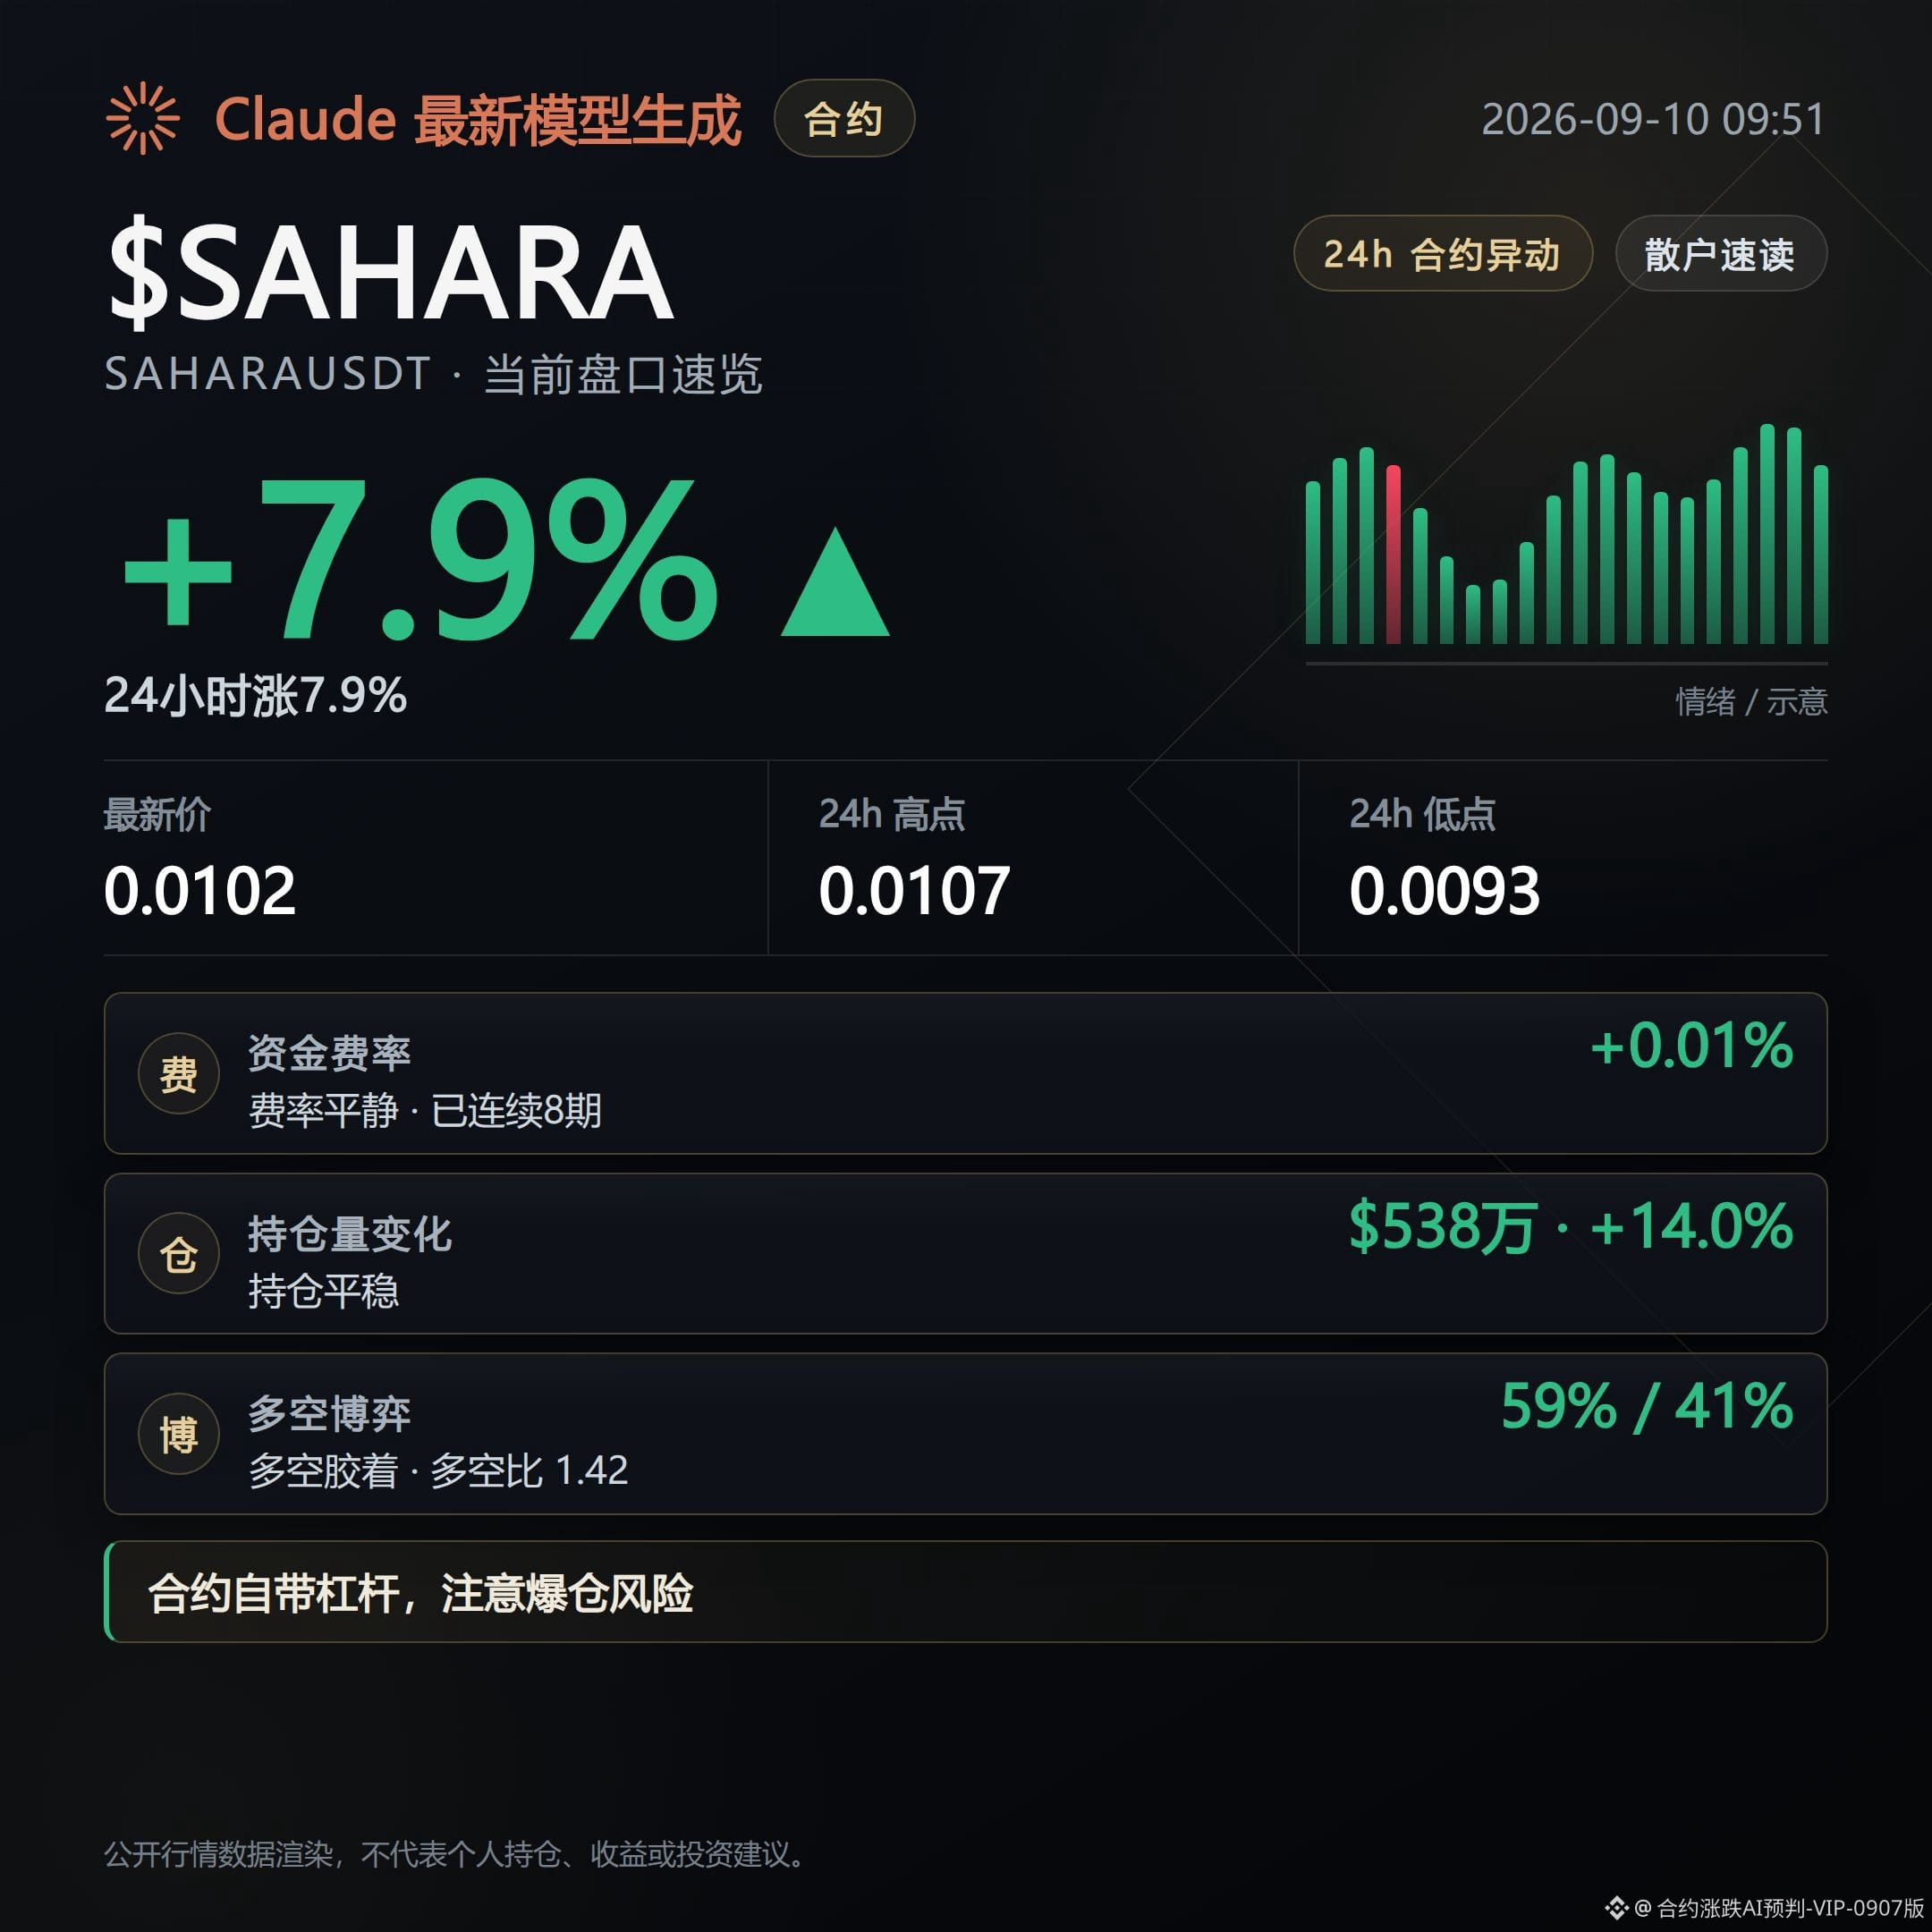
SAHARAUSDT current price 0.010198, up 7.86%. Open interest in the past 24 hours increased by 14%, but the 1-hour timeframe also flipped negative by 3.7%. Meanwhile, the large trader long/short ratio has climbed to 1.87, which is higher than the general long/short ratio of 1.42. This divergence suggests the liquidity/chips are dispersing: the actions of big players and chasing retail are not lining up. The counter-evidence is that the funding rate is still slightly favoring longs—it hasn’t turned to shorts yet.
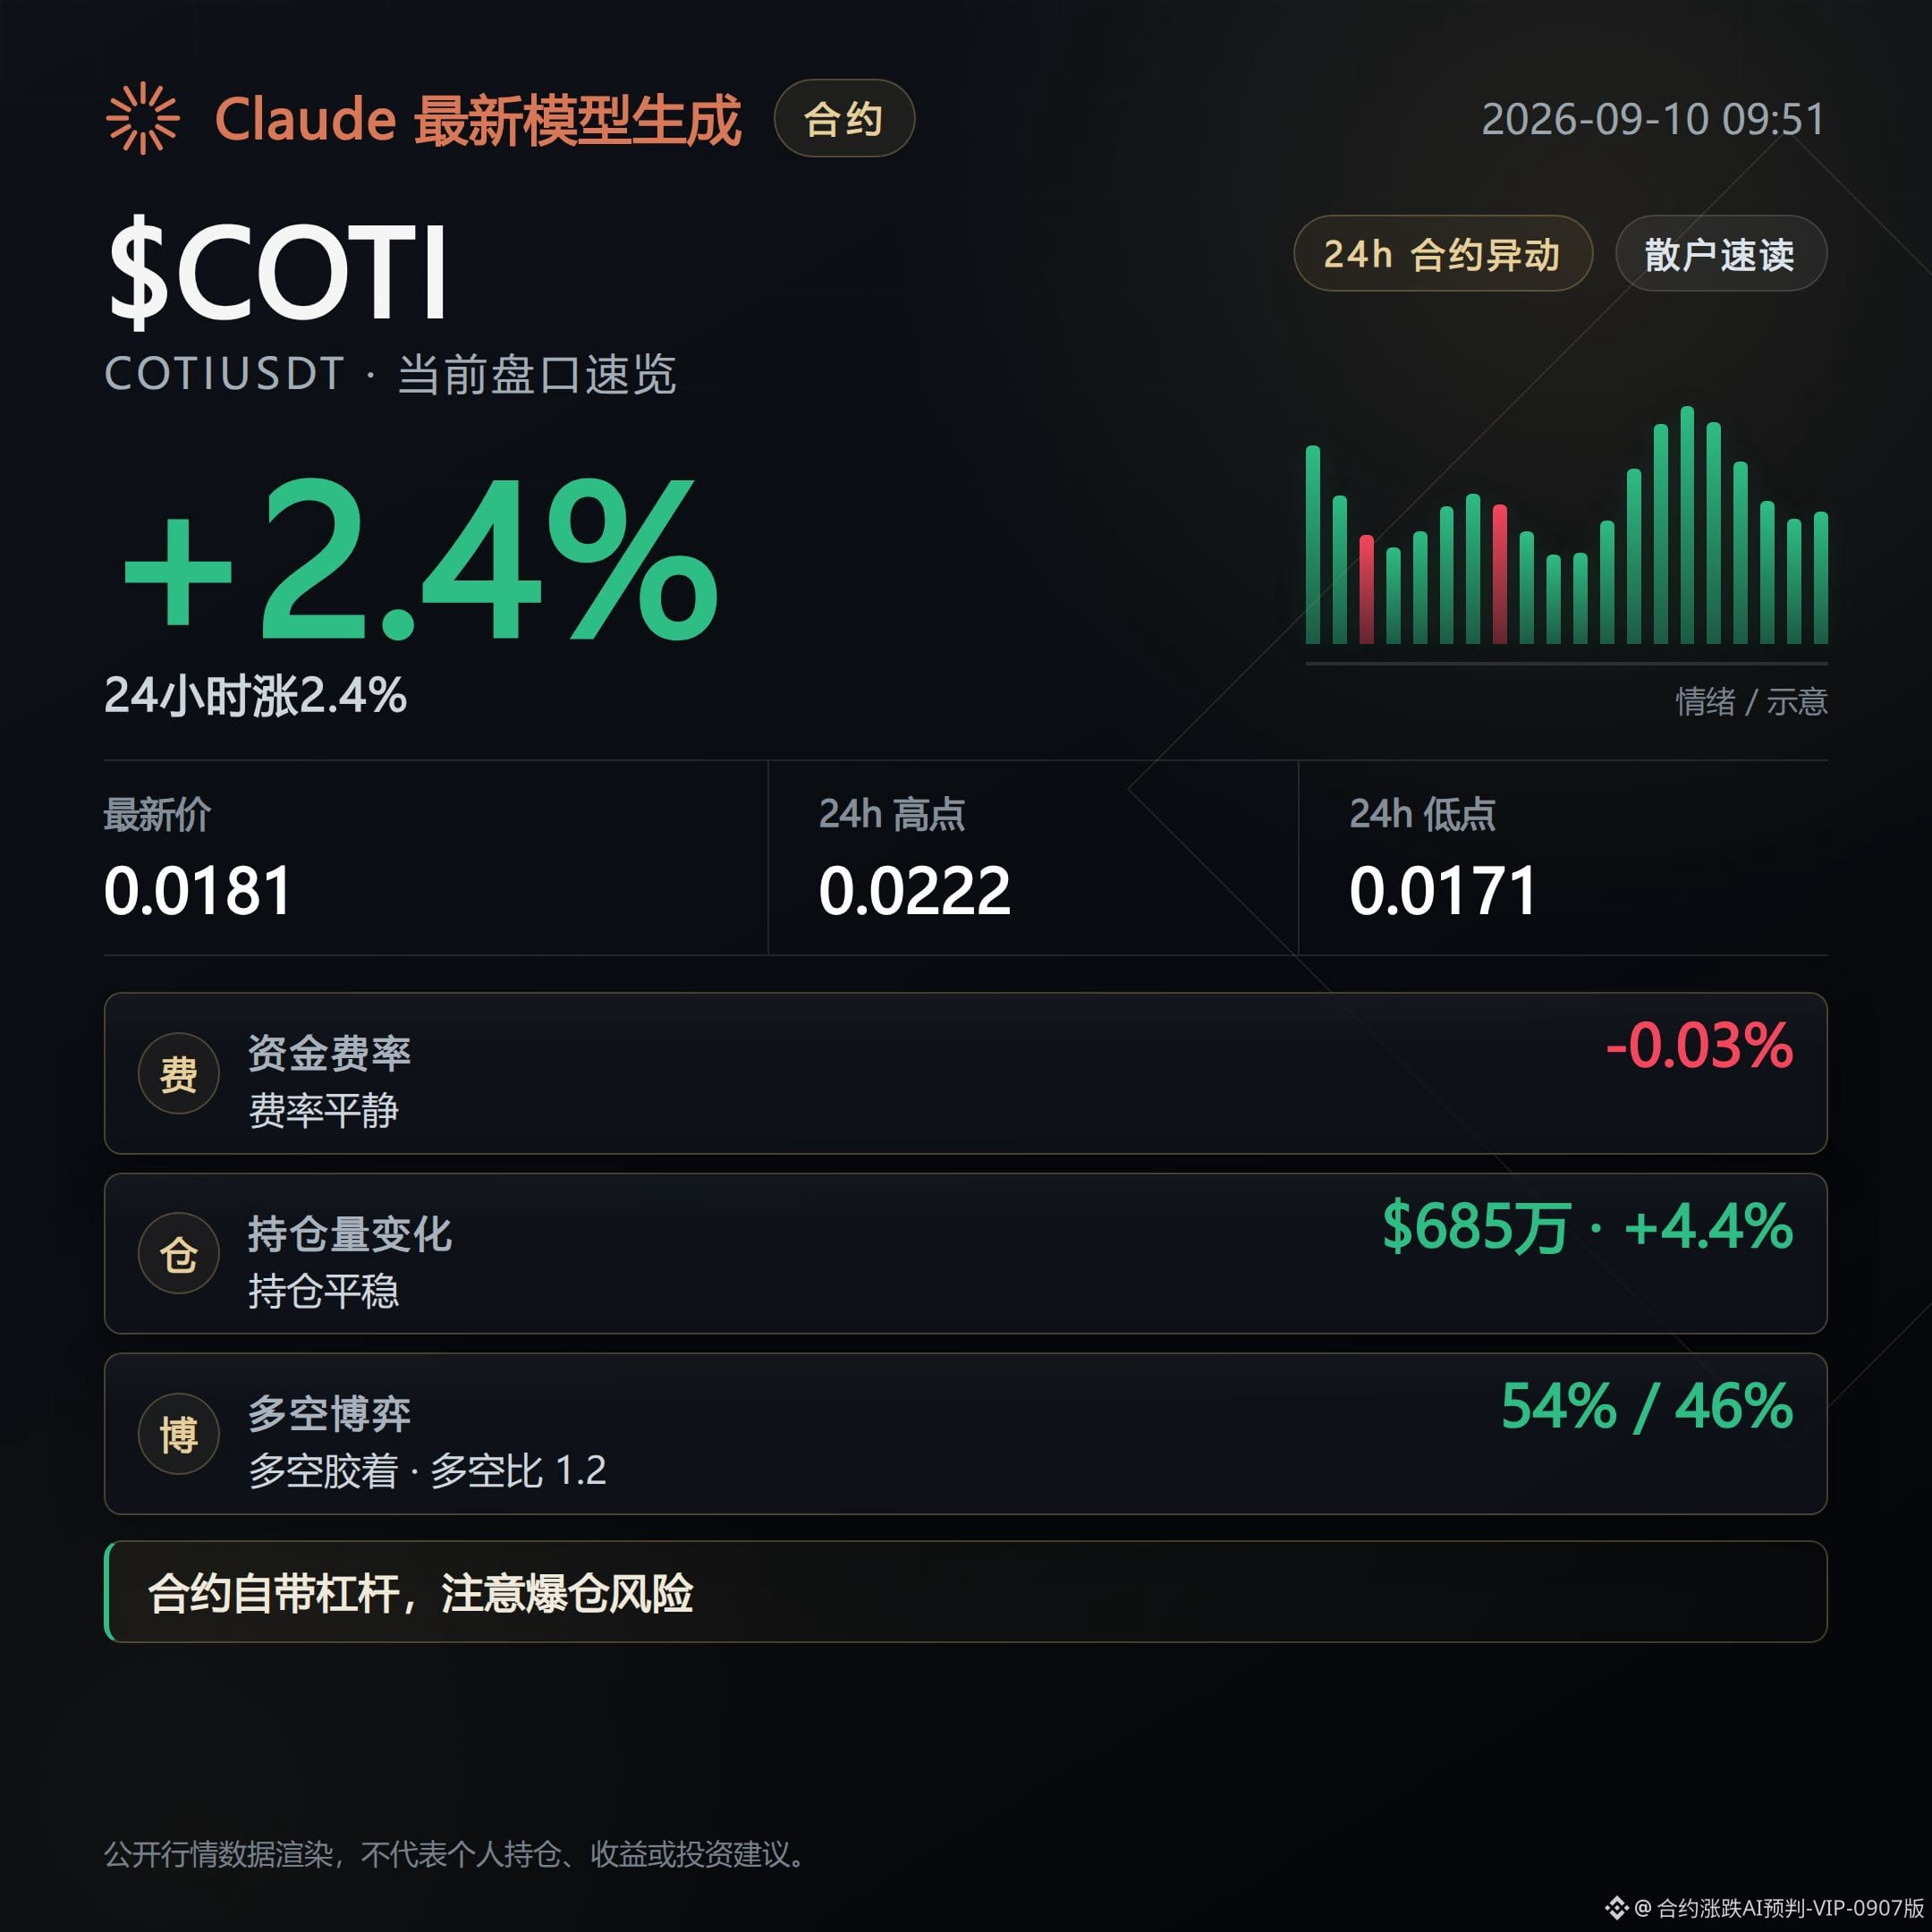
COTIUSDT current price 0.01805. The rally has narrowed to 2.44%. Supertrend has already turned downward. The funding rate has paid shorts for 2 consecutive periods. The premium rate of -0.202% is the deepest among the three, indicating the contract side is clearly weaker than the spot. Open interest has risen only 4.4% in 24 hours—there’s hardly any meaningful new position adding. Pullback conditions are therefore more ahead of the other two. The counter-evidence is that the active buy/sell ratio is 0.97, which hasn’t reached a clearly bearish level yet.
If the acceptance continues to thin out, the pullback line is already forming. If volume returns and the price holds above, then this assessment needs to be reconsidered.
#KAT #SAHARA #COTI
Open-interest note: This account’s live trading holds $FOGO long positions. Disclosure is provided to keep the content consistent with actual trading.
This content is assisted by Claude Fable 5 for generation, for reference only—please verify it yourself.
What you fear isn’t that it won’t rise, but that as it rises, the bids/acceptance will thin out. What to watch next is whether the pullback truly begins.
KATUSDT current price 0.005751, up 18.24% in 24 hours. It looks pretty strong, but the funding rate has paid short positions for 5 consecutive periods, and open interest has surged 105.3% in 24 hours. Yet in the 1-hour timeframe it has already flipped negative by 2.8%. Positions have flowed in, but while the price is still up, the structure is loosening. Chasing longs at higher levels can leave you getting hit by both a snapback and a pullback at the same time. The counter-evidence is that the Supertrend indicator is still moving upward, so the direction hasn’t broken down completely.
SAHARAUSDT current price 0.010198, up 7.86%. Open interest in the past 24 hours increased by 14%, but the 1-hour timeframe also flipped negative by 3.7%. Meanwhile, the large trader long/short ratio has climbed to 1.87, which is higher than the general long/short ratio of 1.42. This divergence suggests the liquidity/chips are dispersing: the actions of big players and chasing retail are not lining up. The counter-evidence is that the funding rate is still slightly favoring longs—it hasn’t turned to shorts yet.
COTIUSDT current price 0.01805. The rally has narrowed to 2.44%. Supertrend has already turned downward. The funding rate has paid shorts for 2 consecutive periods. The premium rate of -0.202% is the deepest among the three, indicating the contract side is clearly weaker than the spot. Open interest has risen only 4.4% in 24 hours—there’s hardly any meaningful new position adding. Pullback conditions are therefore more ahead of the other two. The counter-evidence is that the active buy/sell ratio is 0.97, which hasn’t reached a clearly bearish level yet.
If the acceptance continues to thin out, the pullback line is already forming. If volume returns and the price holds above, then this assessment needs to be reconsidered.
#KAT #SAHARA #COTI
Open-interest note: This account’s live trading holds $FOGO long positions. Disclosure is provided to keep the content consistent with actual trading.
This content is assisted by Claude Fable 5 for generation, for reference only—please verify it yourself.