🔥 Bitcoin (BTC/USD) analysis on the 1-hour timeframe - SMC concepts 🔥
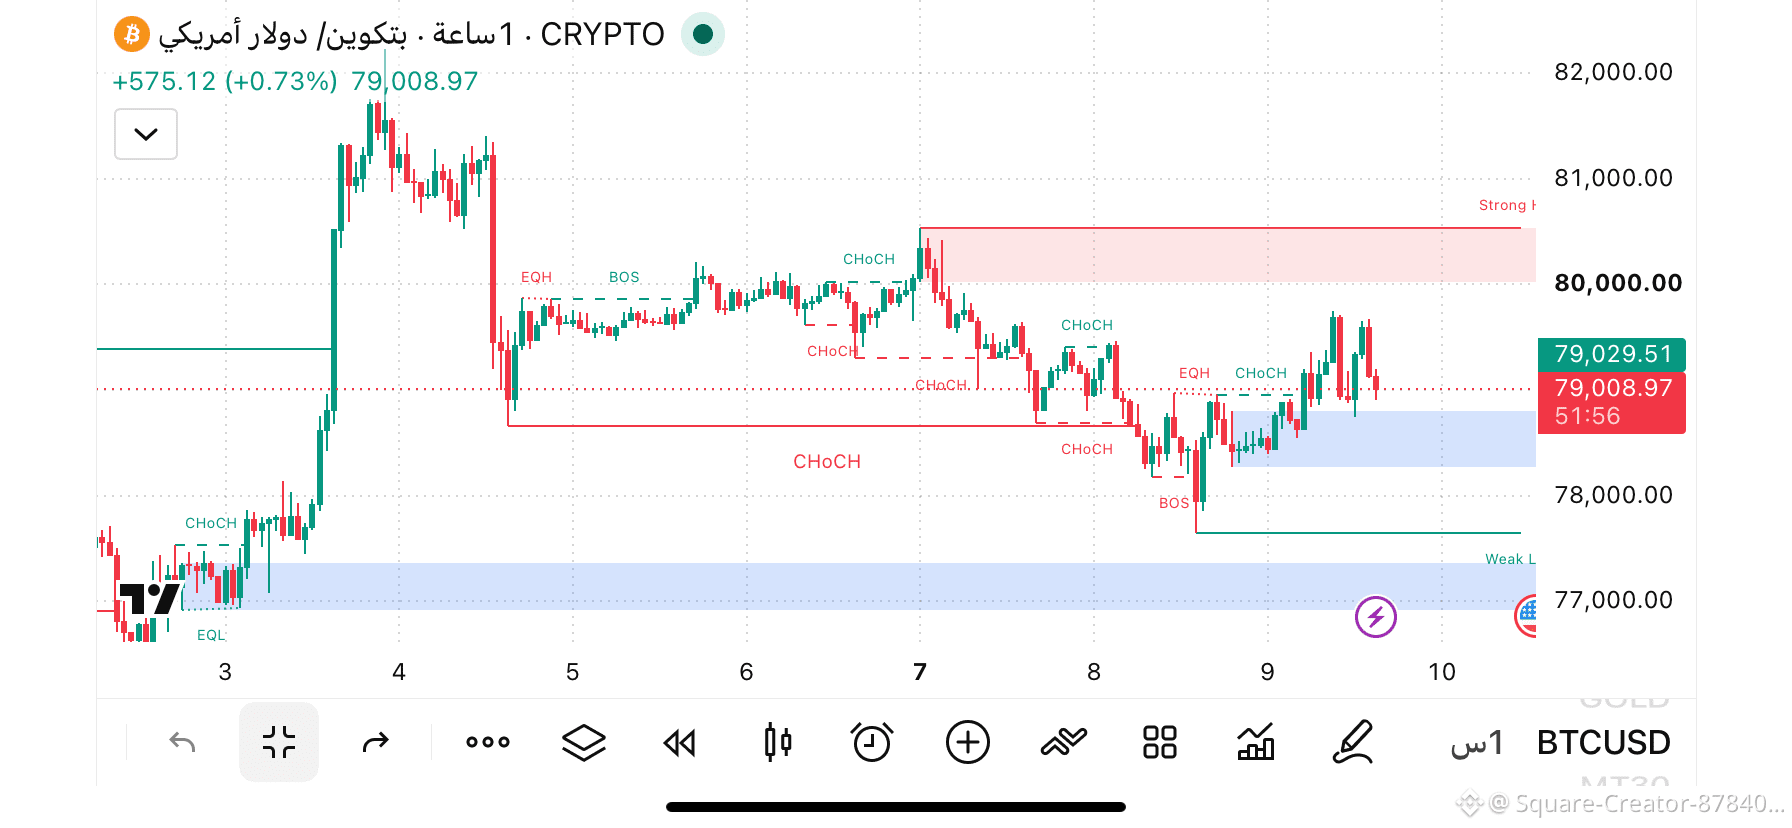
Bitcoin is currently trading around the 79,000 levels. Here’s a breakdown of the market structure based on the attached chart:
Current Market Structure:
After the price bounced from the lower demand area and broke the local move pattern (CHoCH) upwards, the price is currently in a consolidation area above a recent range demand zone between 78,300 - 78,800.
Key Supply Zones:
The main supply area and strong high: 80,000 - 80,800 (a red selling zone that has not been fully tested).
Upper liquidity level: 81,500+
Key Demand Zones:
Current demand area (Bullish OB): 78,300 - 78,800 (the blue zone from which the price recently bounced).
Main lower demand area (Weak Low Liquidity): 76,800 - 77,200
💡 Expected trading scenarios:
1. Bullish scenario: Continued bounce from the current demand zone (78,500) to target the upper supply area and the psychological barrier at 80,000.
2. Bearish scenario: If the current demand zone is broken and an hourly candle closes below it, we may see further downside to sweep the weak low’s liquidity (Weak Low) around 77,000.
⚠️ Risk management is essential. This analysis is for educational purposes only and not financial advice.$BTC
#BTC #Bitcoin #SMC #Trading #BinanceSquare
Bitcoin is currently trading around the 79,000 levels. Here’s a breakdown of the market structure based on the attached chart:
Current Market Structure:
After the price bounced from the lower demand area and broke the local move pattern (CHoCH) upwards, the price is currently in a consolidation area above a recent range demand zone between 78,300 - 78,800.
Key Supply Zones:
The main supply area and strong high: 80,000 - 80,800 (a red selling zone that has not been fully tested).
Upper liquidity level: 81,500+
Key Demand Zones:
Current demand area (Bullish OB): 78,300 - 78,800 (the blue zone from which the price recently bounced).
Main lower demand area (Weak Low Liquidity): 76,800 - 77,200
💡 Expected trading scenarios:
1. Bullish scenario: Continued bounce from the current demand zone (78,500) to target the upper supply area and the psychological barrier at 80,000.
2. Bearish scenario: If the current demand zone is broken and an hourly candle closes below it, we may see further downside to sweep the weak low’s liquidity (Weak Low) around 77,000.
⚠️ Risk management is essential. This analysis is for educational purposes only and not financial advice.$BTC
#BTC #Bitcoin #SMC #Trading #BinanceSquare