
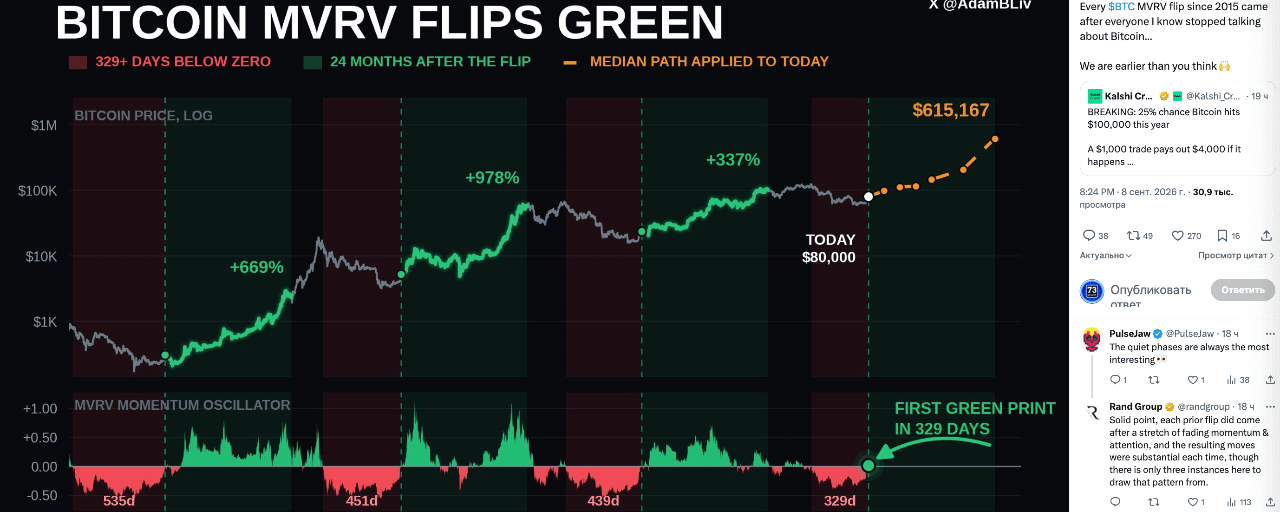


Another indicator, the MVRV Momentum Oscillator, for BTC has also for the first time in 329 days moved into positive territory. Rand Group is paying attention to the signal.
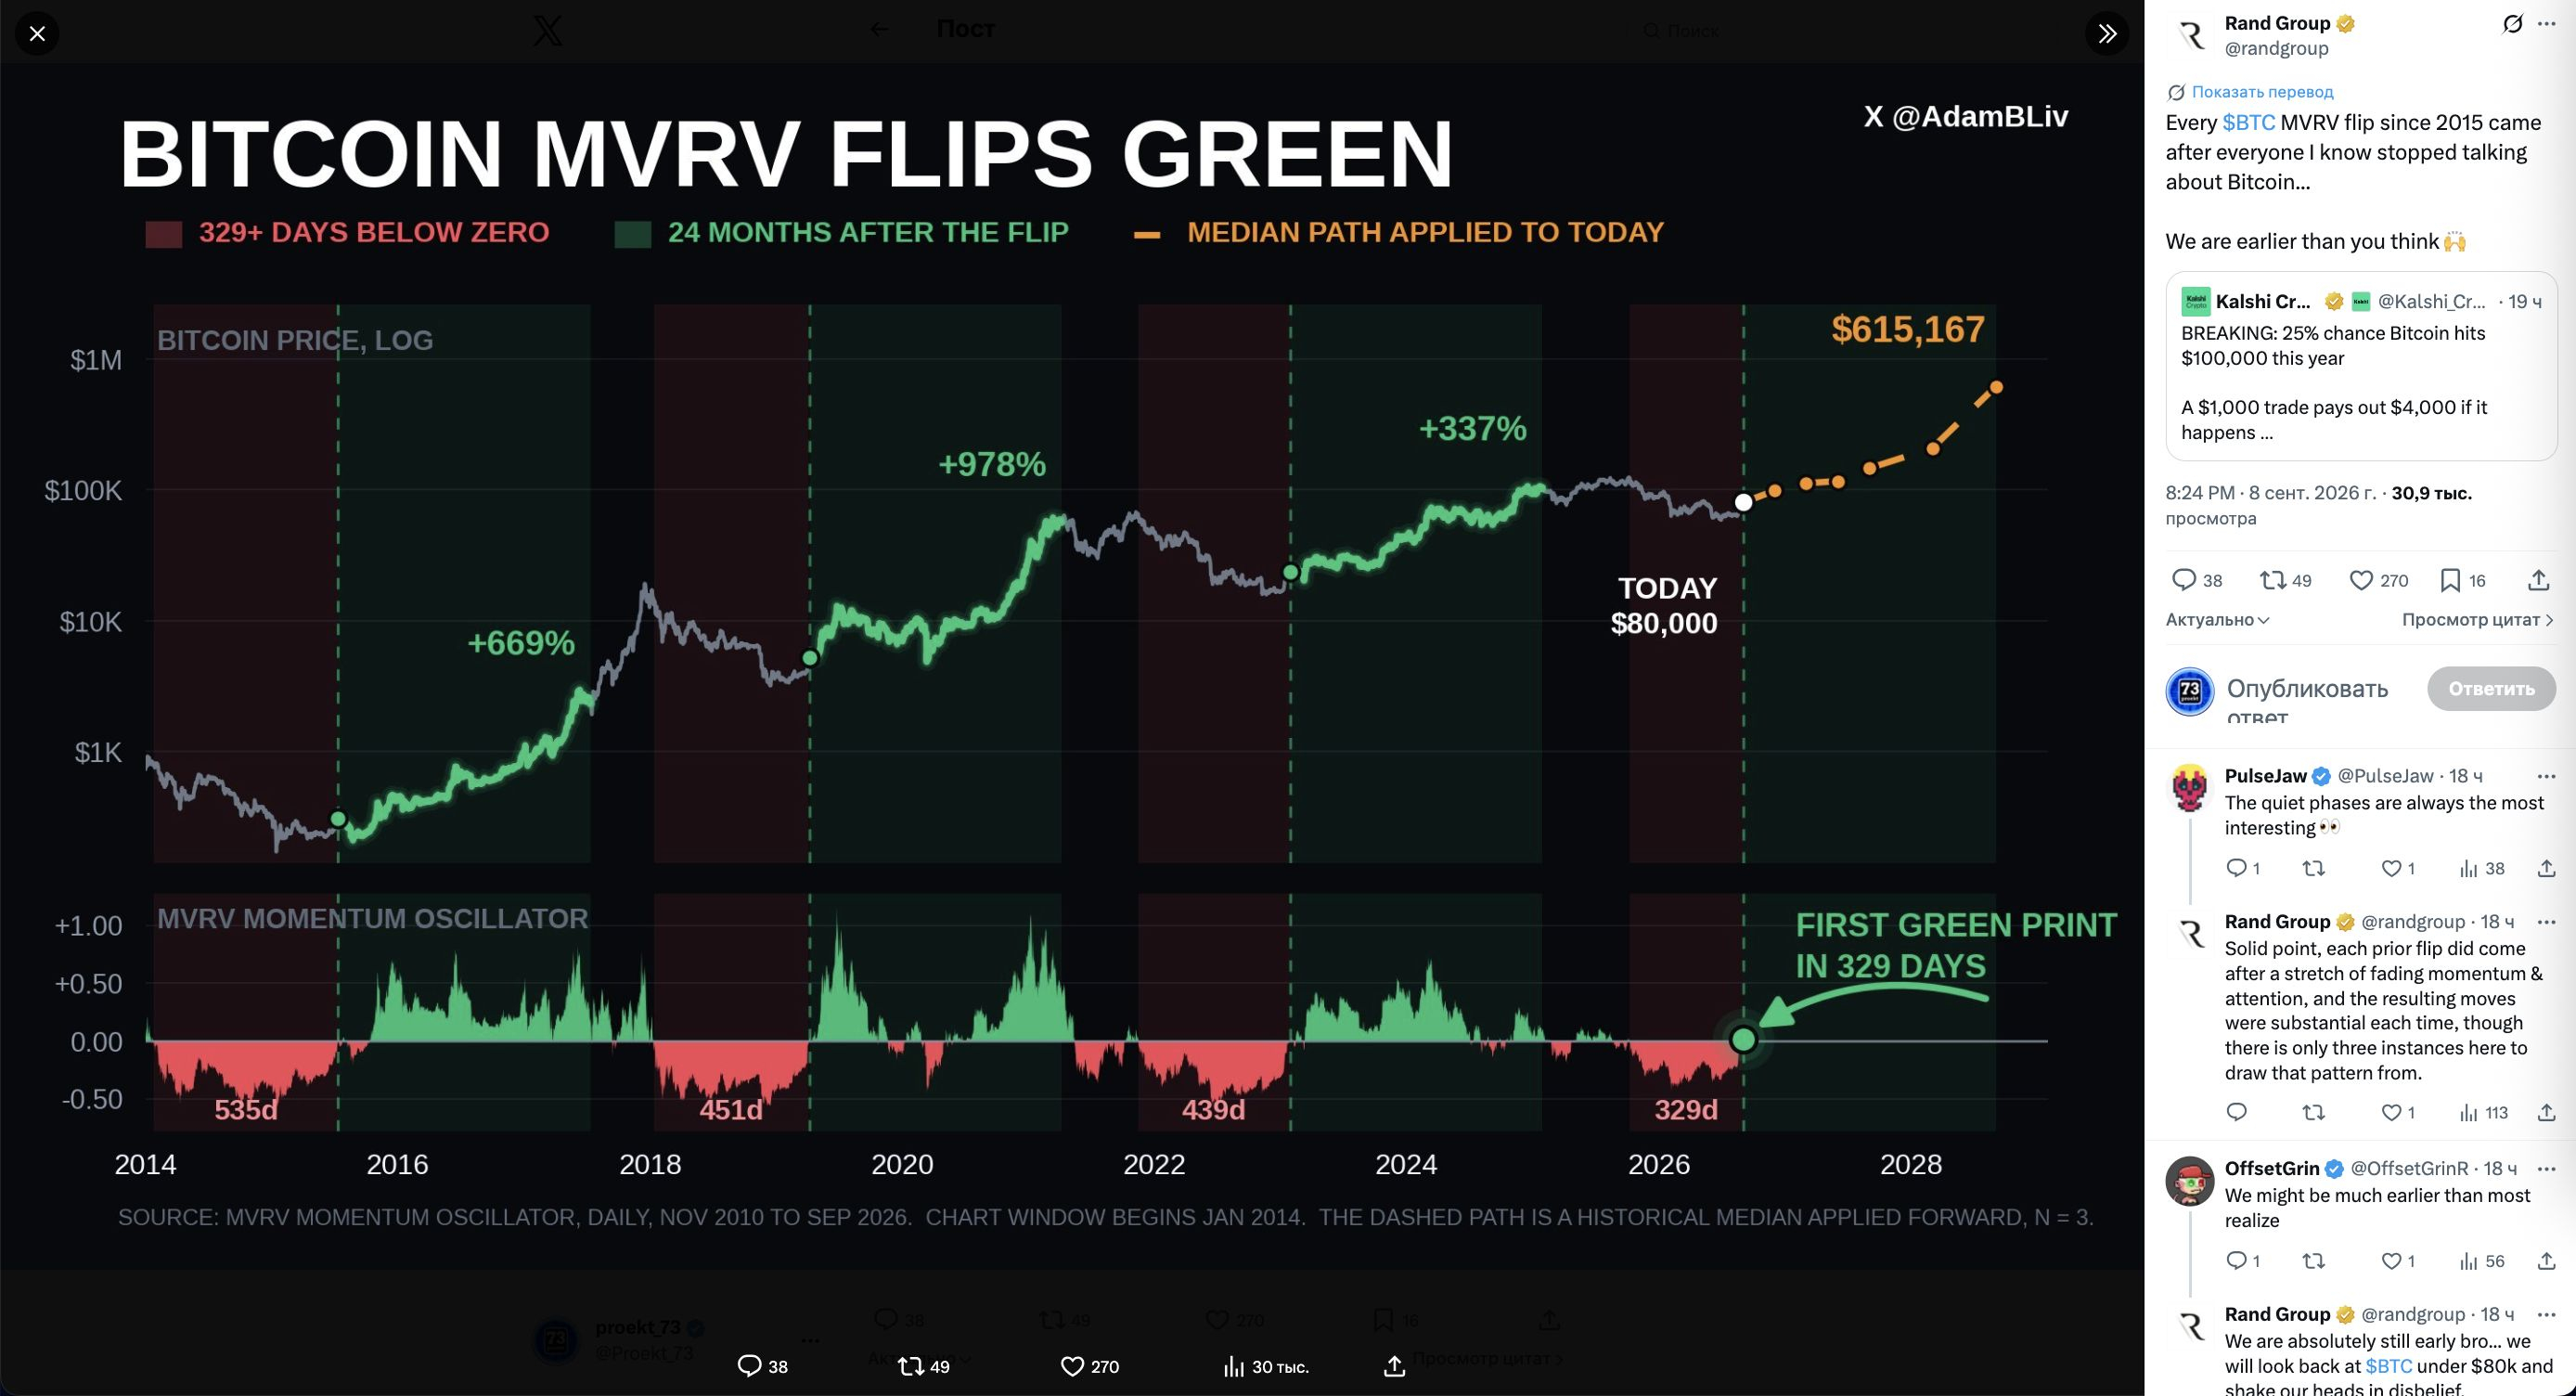
This is not the usual MVRV, but an impulse activation indicator—its move above zero means that the structure of the realized market value has started improving again after a prolonged period of weakness.
Since 2015, a similar transition after a long period below zero happened only three times:
- 2015 - after 535 days in the negative zone, BTC grew by roughly 669% over the next 24 months;
- 2019 - after 451 days, growth reached about 978%.
- 2023 - after 439 days - growth of about 337%.
Right now, the first positive threshold appeared after 329 days below zero, with the BTC price around $80,000.
The chart also shows the median trajectory of the three previous cases. If you simply project it onto the current cycle, it gives... the area of $615,000 about two years from now. Bulls are certainly rubbing their hands.
BUT this is not a guaranteed price forecast. After all, the sample includes only three historical episodes, and the spread of past results is huge—from +337% to +978%.
Therefore the main point of this analysis is not the goal of $615,000, but that after almost a year of a negative impulse, the MVRV market first moved into a mode that in previous cycles coincided with the early stage of a major recovery. The start of a bull market, in other words.