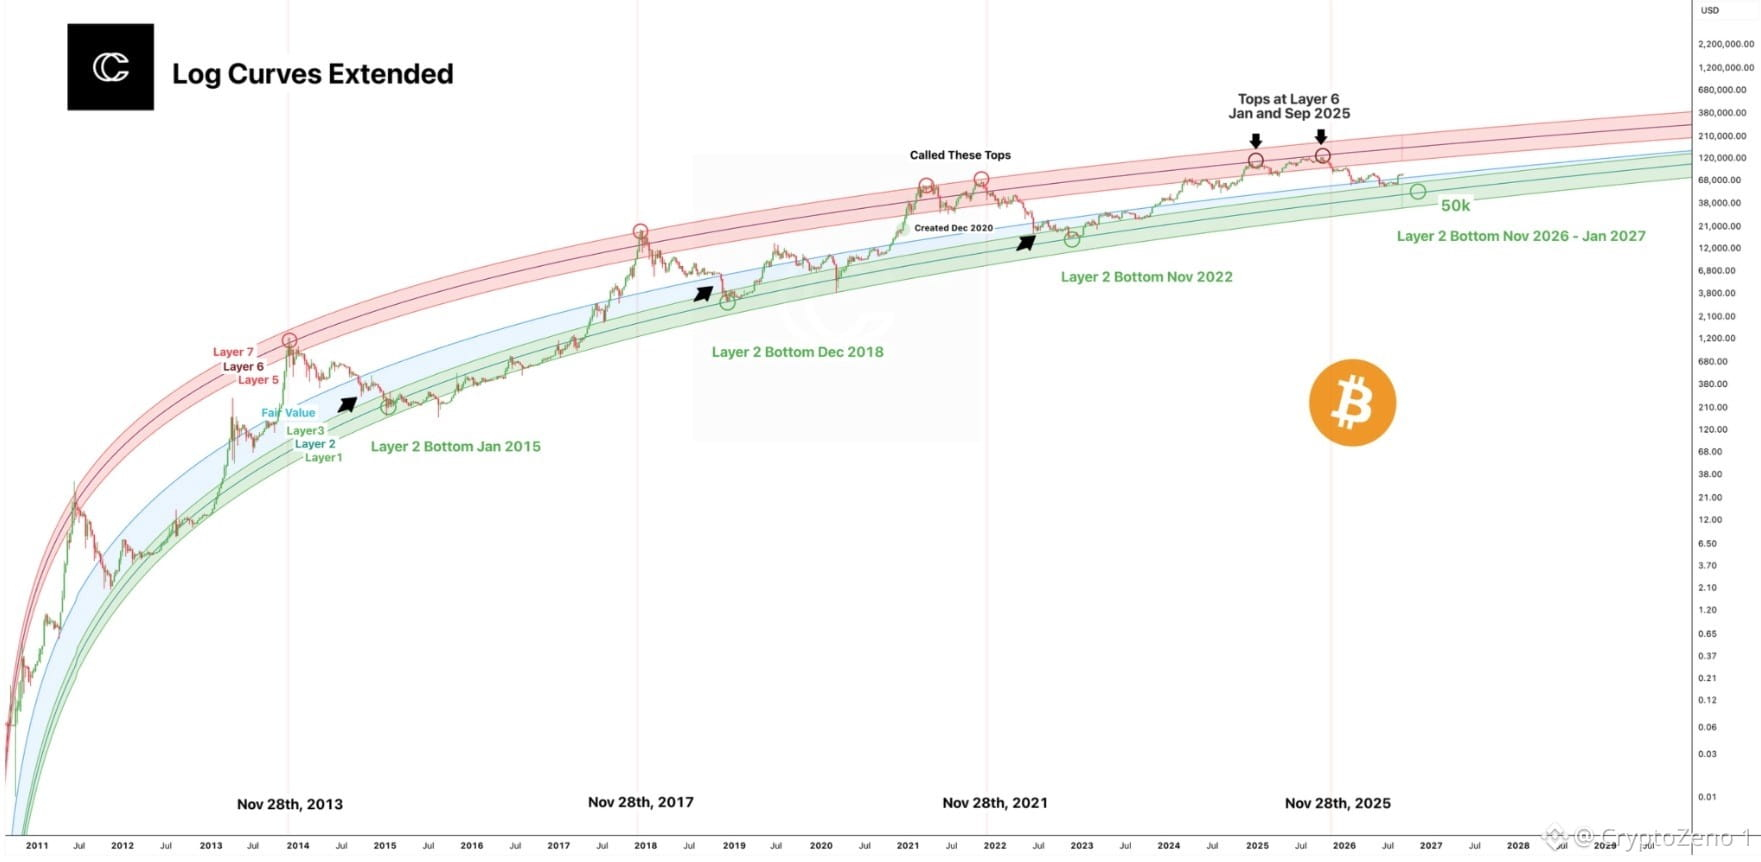
🚨 $BTC Log Curves Are Flashing A 2026–2027 Warning #Bitcoin is once again approaching the upper boundaries of the long term logarithmic growth curve, a zone that has historically aligned with major cycle tops. The chart highlights how previous peaks repeatedly interacted with the upper Layer 6 and Layer 7 bands before entering deep multi month corrections. In 2025, BTC reached the Layer 6 region twice, creating a structure that deserves attention as the cycle matures. What makes the current setup more interesting is the distance between the projected top zone and the historical Layer 2 support structure. The model suggests that if BTC completes another major distribution phase near the upper logarithmic bands, the next large scale correction could eventually push price toward the lower green channel. The projected Layer 2 bottom around November 2026 to January 2027 sits near the $50K area, making it a critical long term valuation zone rather than an immediate target. Historically, these logarithmic curves have acted less like precise price targets and more like structural boundaries for Bitcoin market cycles. Major tops formed near the red bands, while deep bear market bottoms repeatedly found support around the lower green layers. The repeating interaction between these zones suggests that time and price compression may be just as important as momentum when evaluating the current cycle. The key question now is whether BTC can break decisively above the established upper curve and invalidate the historical pattern, or whether the market is approaching another distribution phase. If the logarithmic structure continues to rhyme with previous cycles, the next major opportunity may not come at the top, but after a prolonged reset toward the lower valuation bands. #BTC Price Analysis# #Macro Insights#

Post