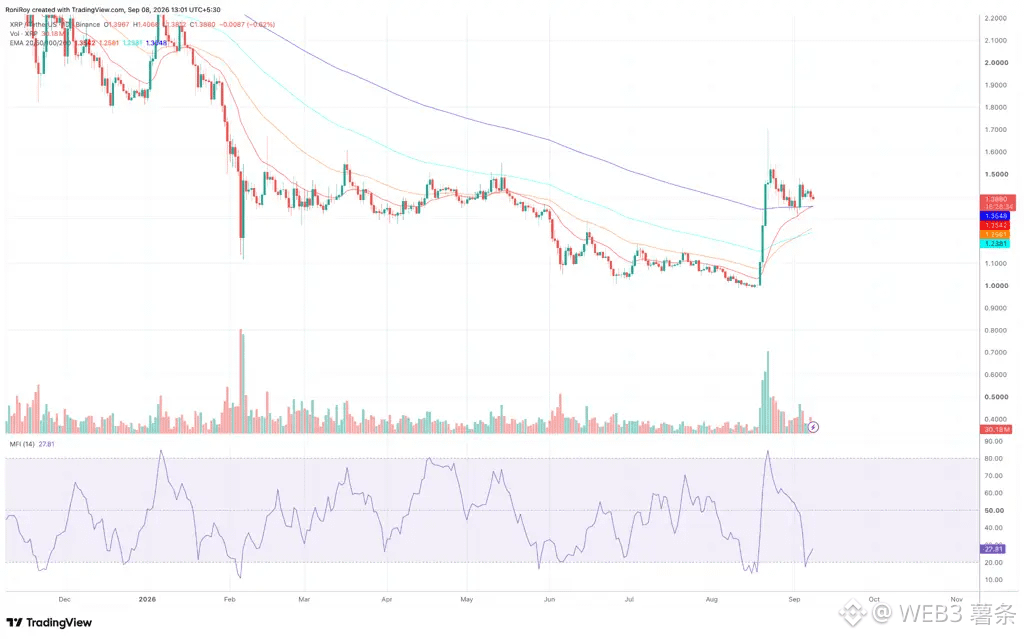
#xrp pulled back after rising in early September, and is currently trading near $1.39. Although it has declined in the short term, the overall trend has not clearly weakened, because the price is still above the 20-day, 50-day, 100-day, and 200-day moving averages.
The most important level to watch is $1.35. Both the 20-day and 200-day moving averages are currently near $1.35, which can be understood as XRP's key "defense line" at the moment. As long as the daily chart can hold above $1.35, the previous upward structure still has a chance to continue.
If XRP regains a firm hold above $1.35, the first upside level to watch is $1.43, and further above that is the $1.48-$1.50 area.
Conversely, if the daily chart breaks below $1.35, it would indicate that short-term support has been lost, and the price may continue to fall toward $1.33, or even test $1.28.
In addition, the money flow indicator has dropped from above 80 earlier to 27.81, showing that buying momentum has clearly cooled recently, but it has not yet entered the oversold zone.
The most important level to watch is $1.35. Both the 20-day and 200-day moving averages are currently near $1.35, which can be understood as XRP's key "defense line" at the moment. As long as the daily chart can hold above $1.35, the previous upward structure still has a chance to continue.
If XRP regains a firm hold above $1.35, the first upside level to watch is $1.43, and further above that is the $1.48-$1.50 area.
Conversely, if the daily chart breaks below $1.35, it would indicate that short-term support has been lost, and the price may continue to fall toward $1.33, or even test $1.28.
In addition, the money flow indicator has dropped from above 80 earlier to 27.81, showing that buying momentum has clearly cooled recently, but it has not yet entered the oversold zone.