
📊 SUMMARY OF BTC/USDT ANALYSIS (H1 timeframe)
1. SESSION OVERVIEW SUMMARY:
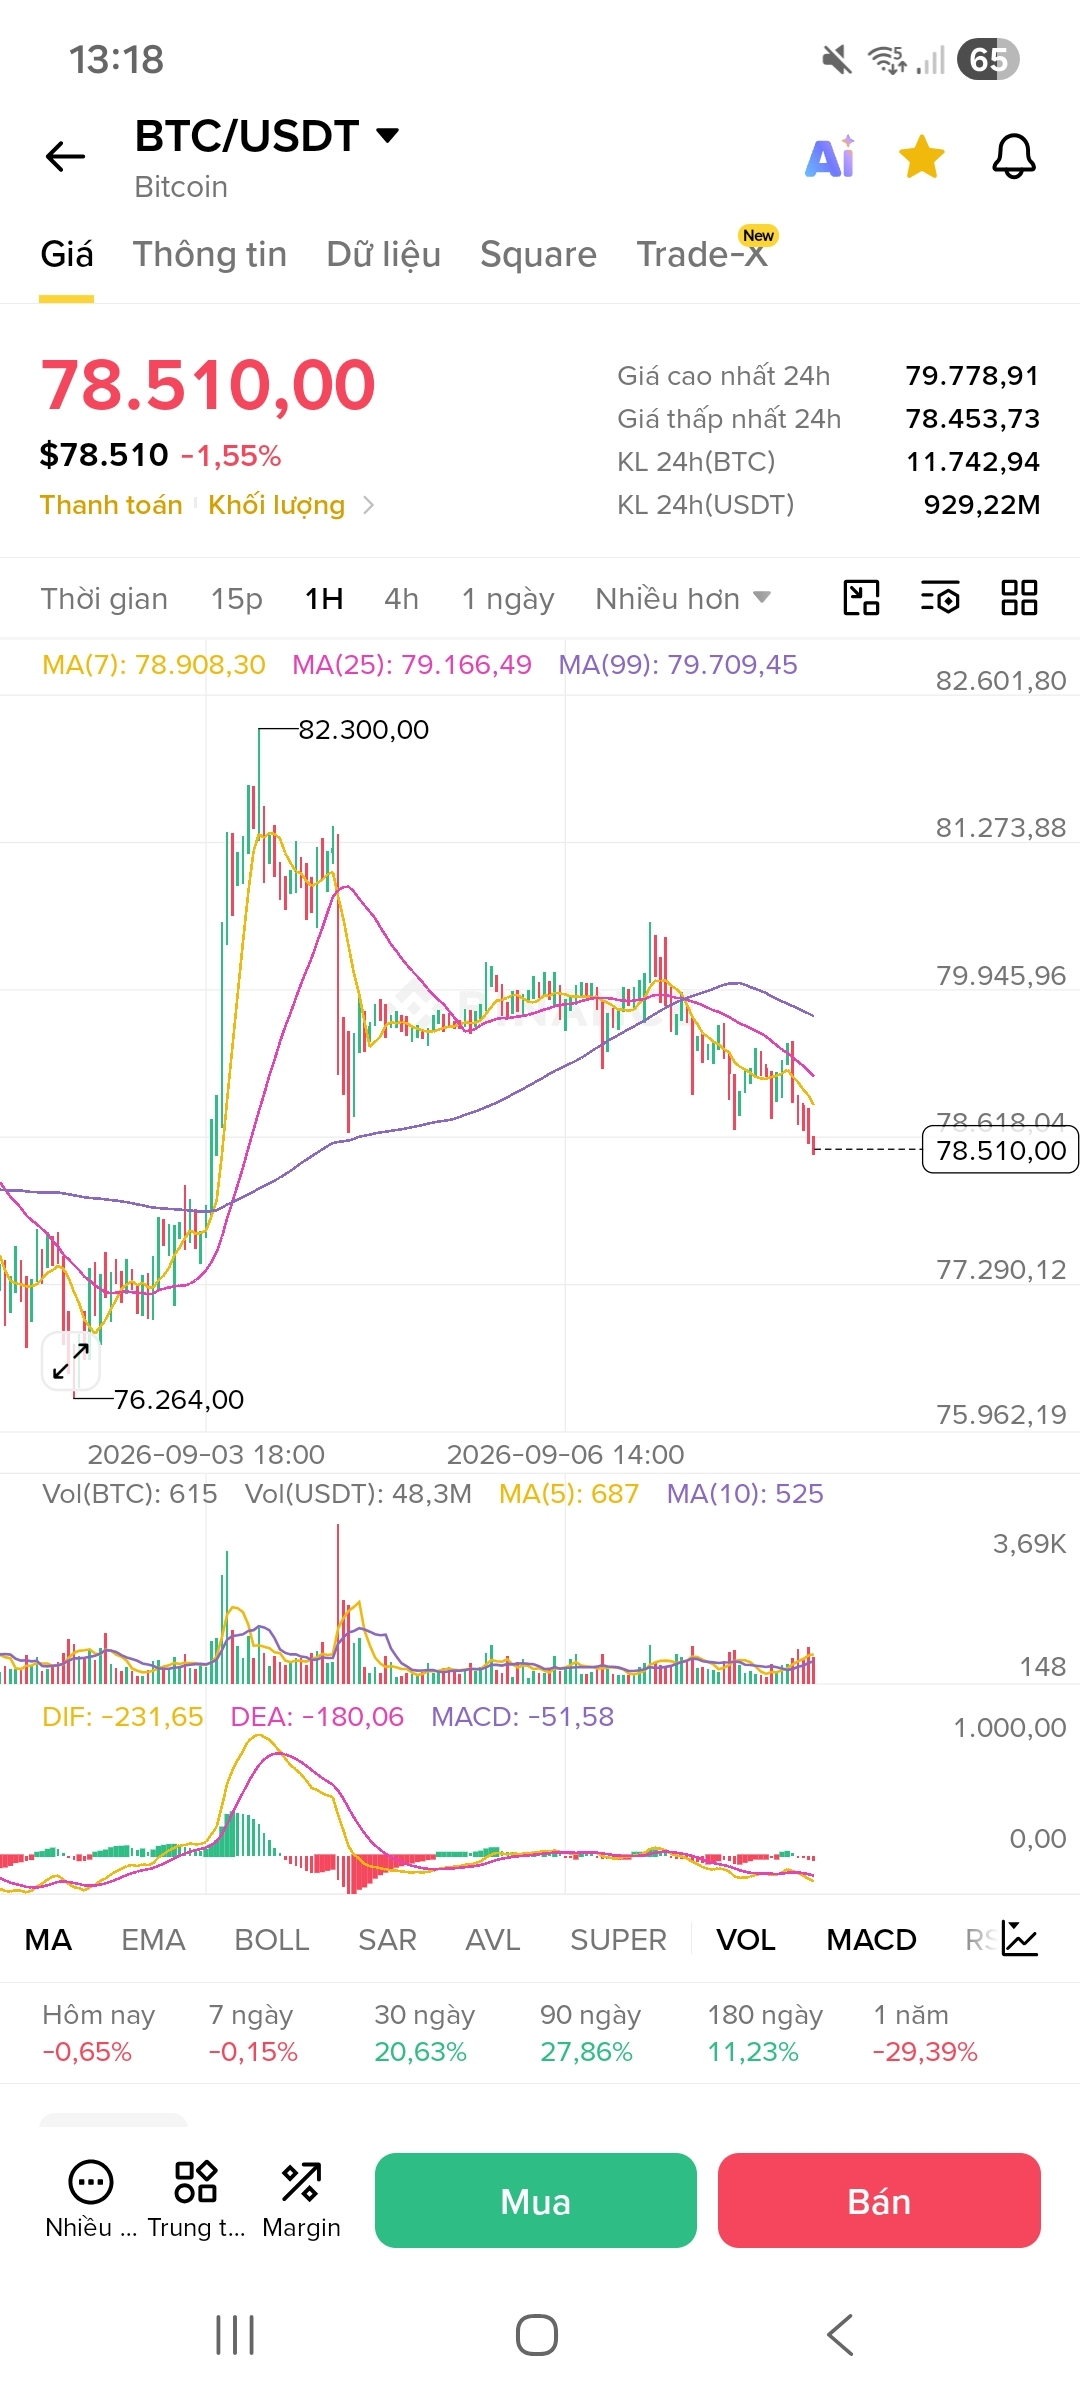
- Current price: 78.510,00 USDT (Down -1.55%).
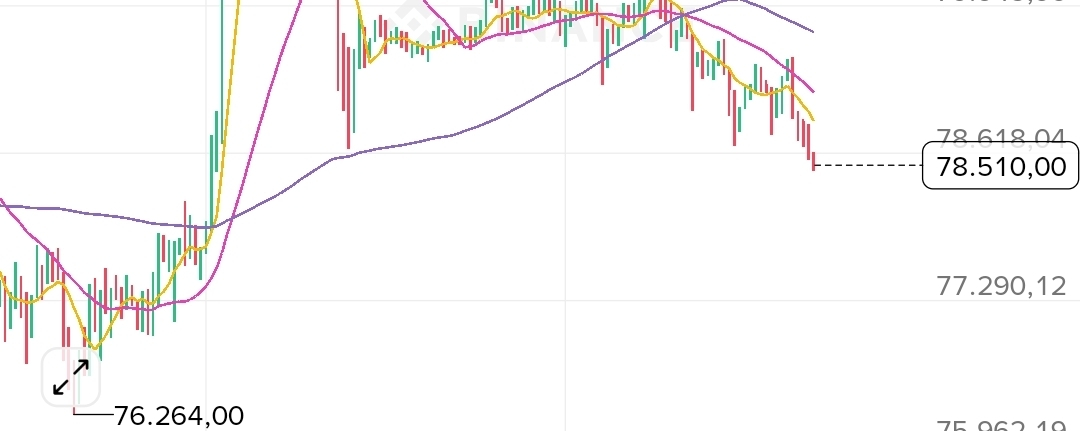
- Short-term trend: The selling side is completely in control after the price was strongly rejected at the 82,300 USDT peak.
- Technical signals: The price has fallen below the MA(7) and MA(25) lines. The MACD indicator has crossed below 0 with a widening red histogram, confirming that the bearish downtrend momentum is increasing.
- Asian session bottom zone: Temporarily hold around 78.453,73 USDT.
2. TRADING DIRECTION FOR THE EUROPEAN SESSION:
- Main strategy: Prioritize SELL (Short) in line with the correction trend; limit catching the bottom (Long) too early.
📌 Price levels to note:
- Resistance zone (Consider Short): 79.160 – 79.800 USDT (Overlapping area of MA25 and MA99). Wait for a technical pullback here; if a rejection candle appears, open a Short position.
- Support zone (Watch for Breakout): 78.450 – 78.500 USDT. If the European session breaks below this level with high volume, BTC may continue falling to 77.290 USDT and 76.264 USDT.
- Stop Loss: Set strictly above the 80.000 – 80.500 USDT zone to protect the account.
⚠️ NOTE: Between the European session and ahead of the US session, there is often a strong liquidity sweep (Kill Long/Short). Therefore, be patient and wait for the price to establish a clearly defined resistance/support zone before entering a trade. $BTC