$BTC Liying Chat Coins: Latest Market Analysis of 9.8 Bitcoin (BTC) and Ethereum (ETH)
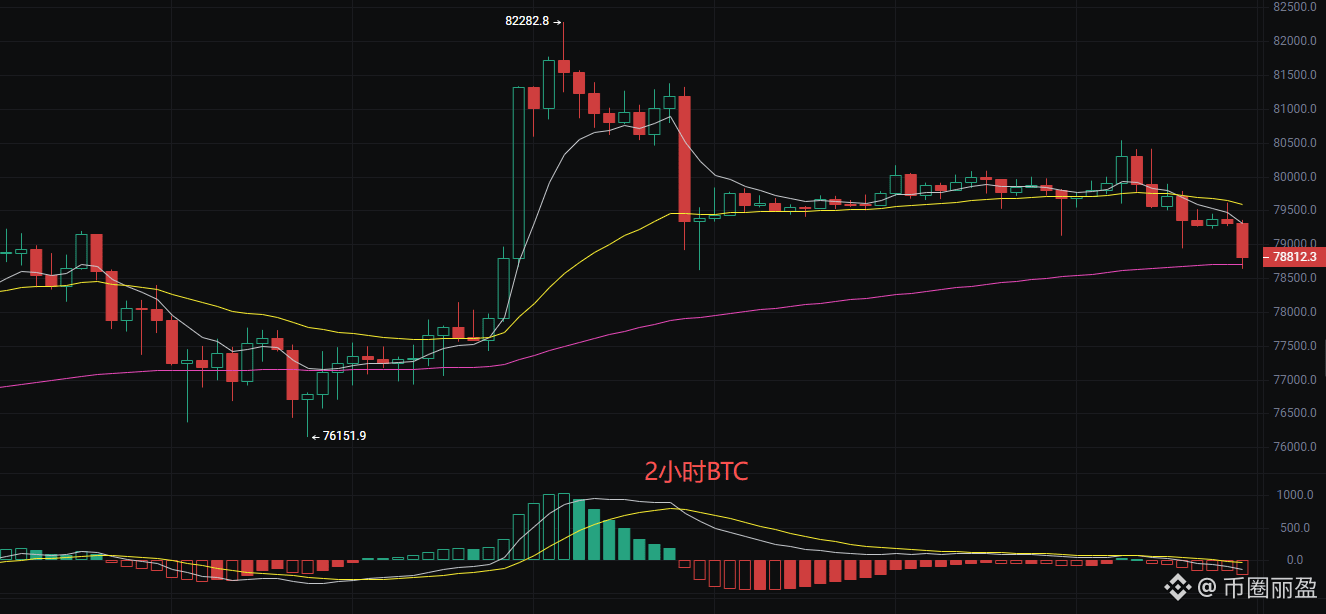
Family members! Bitcoin’s current price is 79,000, and it has just dropped to the vicinity of the Bollinger Band midline—around 79,700. The technical indicators currently lean bearish, but there is demand for a rebound from oversold conditions. The EMA moving-average system shows that the short-term EMA7 has fallen below the EMA30 to form a dead cross, and the price is still not far above the EMA120, indicating that the short-term trend has weakened, while the long-term trendline is still providing support. The MACD is running below the zero line; both DIF and DEA are negative values, meaning the bears are dominating the market. However, the Bollinger Bands’ opening is starting to narrow. After the price touched the lower band at 79,103, it rebounded somewhat, suggesting that downside momentum is fading. As for trading volume, during the decline there was no panic sell-off, which leaves room for the market to potentially stabilize later.
Short-term ideas for reference:
Go long on 78,700–78,800, stop loss 500 points, target 79,500, aiming for 79,800.
Go short on 79,800–80,000, stop loss 500 points, target 79,200, aiming for 79,000.
Ethereum
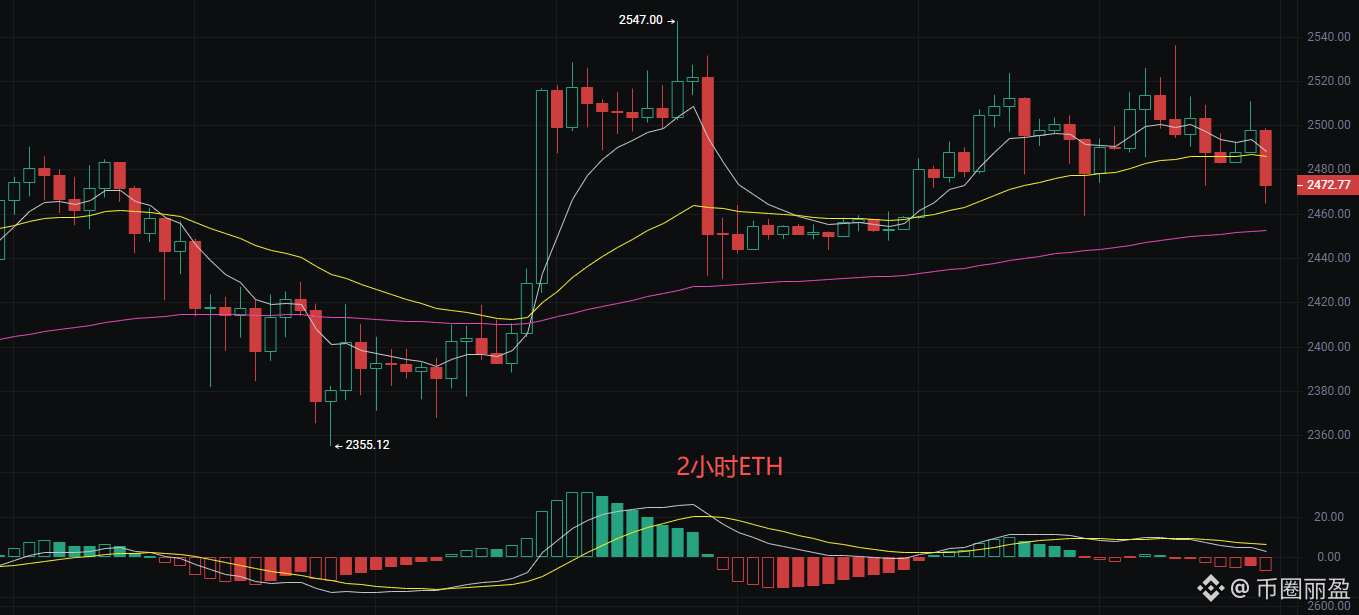
Family members, Ethereum is currently at 2,484. After a surge up to 2,547, it has pulled back and is now hovering between several moving averages. This kind of “stuck in the middle” range-bound action really tests patience, but it also is often a sign that a breakout is coming. Currently, the technical indicators show the EMA moving-average system in a tangled state: EMA7 near 2,490 forms short-term resistance, while EMA30 and EMA120 at 2,486 and 2,452 provide support respectively. This indicates the medium-term trend remains bullish, but the short-term is being blocked. The MACD’s DIF and DEA dead-cross and downward adjustment have not finished yet. The Bollinger Bands are clearly narrowing; the midline at 2,496 is overhead pressure, while the lower band at 2,476 is a key defensive level. The price is currently consolidating between the mid and lower bands, volatility is compressing, and it suggests the market is about to choose a direction.
Short-term level references
Go long on 2,470, defense 2,460, stop loss 30 points, target 2,510, aiming for 2,520.
Go short on 2,490, defense 2,500, stop loss 30 points, target 2,470, aiming for 2,460.
The above content is an exclusive original by Liying. If you reprint it, please indicate the source. There may be a delay in the article’s publication review. As market conditions can change in an instant, the above suggestions are for reference only—risk is to be borne by you.
#BTC走势分析
Family members! Bitcoin’s current price is 79,000, and it has just dropped to the vicinity of the Bollinger Band midline—around 79,700. The technical indicators currently lean bearish, but there is demand for a rebound from oversold conditions. The EMA moving-average system shows that the short-term EMA7 has fallen below the EMA30 to form a dead cross, and the price is still not far above the EMA120, indicating that the short-term trend has weakened, while the long-term trendline is still providing support. The MACD is running below the zero line; both DIF and DEA are negative values, meaning the bears are dominating the market. However, the Bollinger Bands’ opening is starting to narrow. After the price touched the lower band at 79,103, it rebounded somewhat, suggesting that downside momentum is fading. As for trading volume, during the decline there was no panic sell-off, which leaves room for the market to potentially stabilize later.
Short-term ideas for reference:
Go long on 78,700–78,800, stop loss 500 points, target 79,500, aiming for 79,800.
Go short on 79,800–80,000, stop loss 500 points, target 79,200, aiming for 79,000.
Ethereum
Family members, Ethereum is currently at 2,484. After a surge up to 2,547, it has pulled back and is now hovering between several moving averages. This kind of “stuck in the middle” range-bound action really tests patience, but it also is often a sign that a breakout is coming. Currently, the technical indicators show the EMA moving-average system in a tangled state: EMA7 near 2,490 forms short-term resistance, while EMA30 and EMA120 at 2,486 and 2,452 provide support respectively. This indicates the medium-term trend remains bullish, but the short-term is being blocked. The MACD’s DIF and DEA dead-cross and downward adjustment have not finished yet. The Bollinger Bands are clearly narrowing; the midline at 2,496 is overhead pressure, while the lower band at 2,476 is a key defensive level. The price is currently consolidating between the mid and lower bands, volatility is compressing, and it suggests the market is about to choose a direction.
Short-term level references
Go long on 2,470, defense 2,460, stop loss 30 points, target 2,510, aiming for 2,520.
Go short on 2,490, defense 2,500, stop loss 30 points, target 2,470, aiming for 2,460.
The above content is an exclusive original by Liying. If you reprint it, please indicate the source. There may be a delay in the article’s publication review. As market conditions can change in an instant, the above suggestions are for reference only—risk is to be borne by you.
#BTC走势分析