2-year-ahead leads in overnight: don’t just watch the Fed’s talk
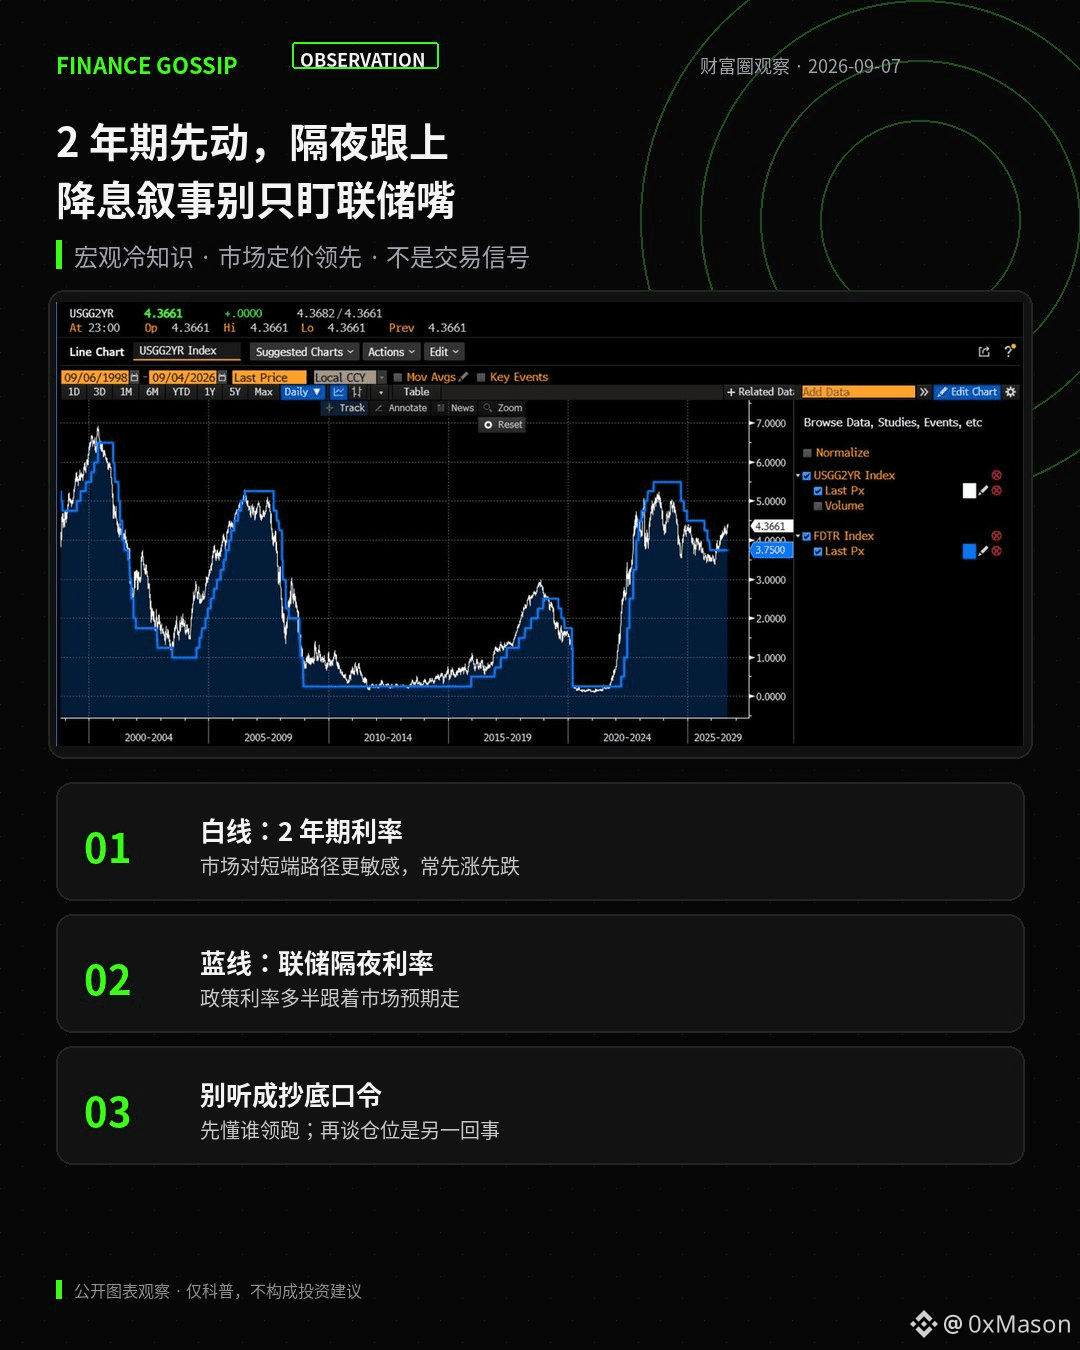
I came across an old chart: the white line is the U.S. Treasury 2-year yield, and the blue line is the Fed’s overnight rate. Most of the time, the white line turns first, and the blue line follows—whether it’s rate hikes or rate cuts.
In plain terms: the market prices the short end first, and the Fed then rubber-stamps it. If you keep asking every day, “Will they cut tonight?”, the 2-year yield may have already answered you.
When I work on payments and account products, I also like to look at this kind of lead-lag relationship—not to chase bottoms, but to avoid being carried along by talk. First figure out who’s leading, then talk about positioning. Treat this chart as trivia—not as a cue to open long positions tonight.
I came across an old chart: the white line is the U.S. Treasury 2-year yield, and the blue line is the Fed’s overnight rate. Most of the time, the white line turns first, and the blue line follows—whether it’s rate hikes or rate cuts.
In plain terms: the market prices the short end first, and the Fed then rubber-stamps it. If you keep asking every day, “Will they cut tonight?”, the 2-year yield may have already answered you.
When I work on payments and account products, I also like to look at this kind of lead-lag relationship—not to chase bottoms, but to avoid being carried along by talk. First figure out who’s leading, then talk about positioning. Treat this chart as trivia—not as a cue to open long positions tonight.