📊 BITCOIN WEEKLY ANALYSIS: BTC just closed the week sitting directly on top of its 50-week moving average, and three major US economic events could decide which way it breaks.
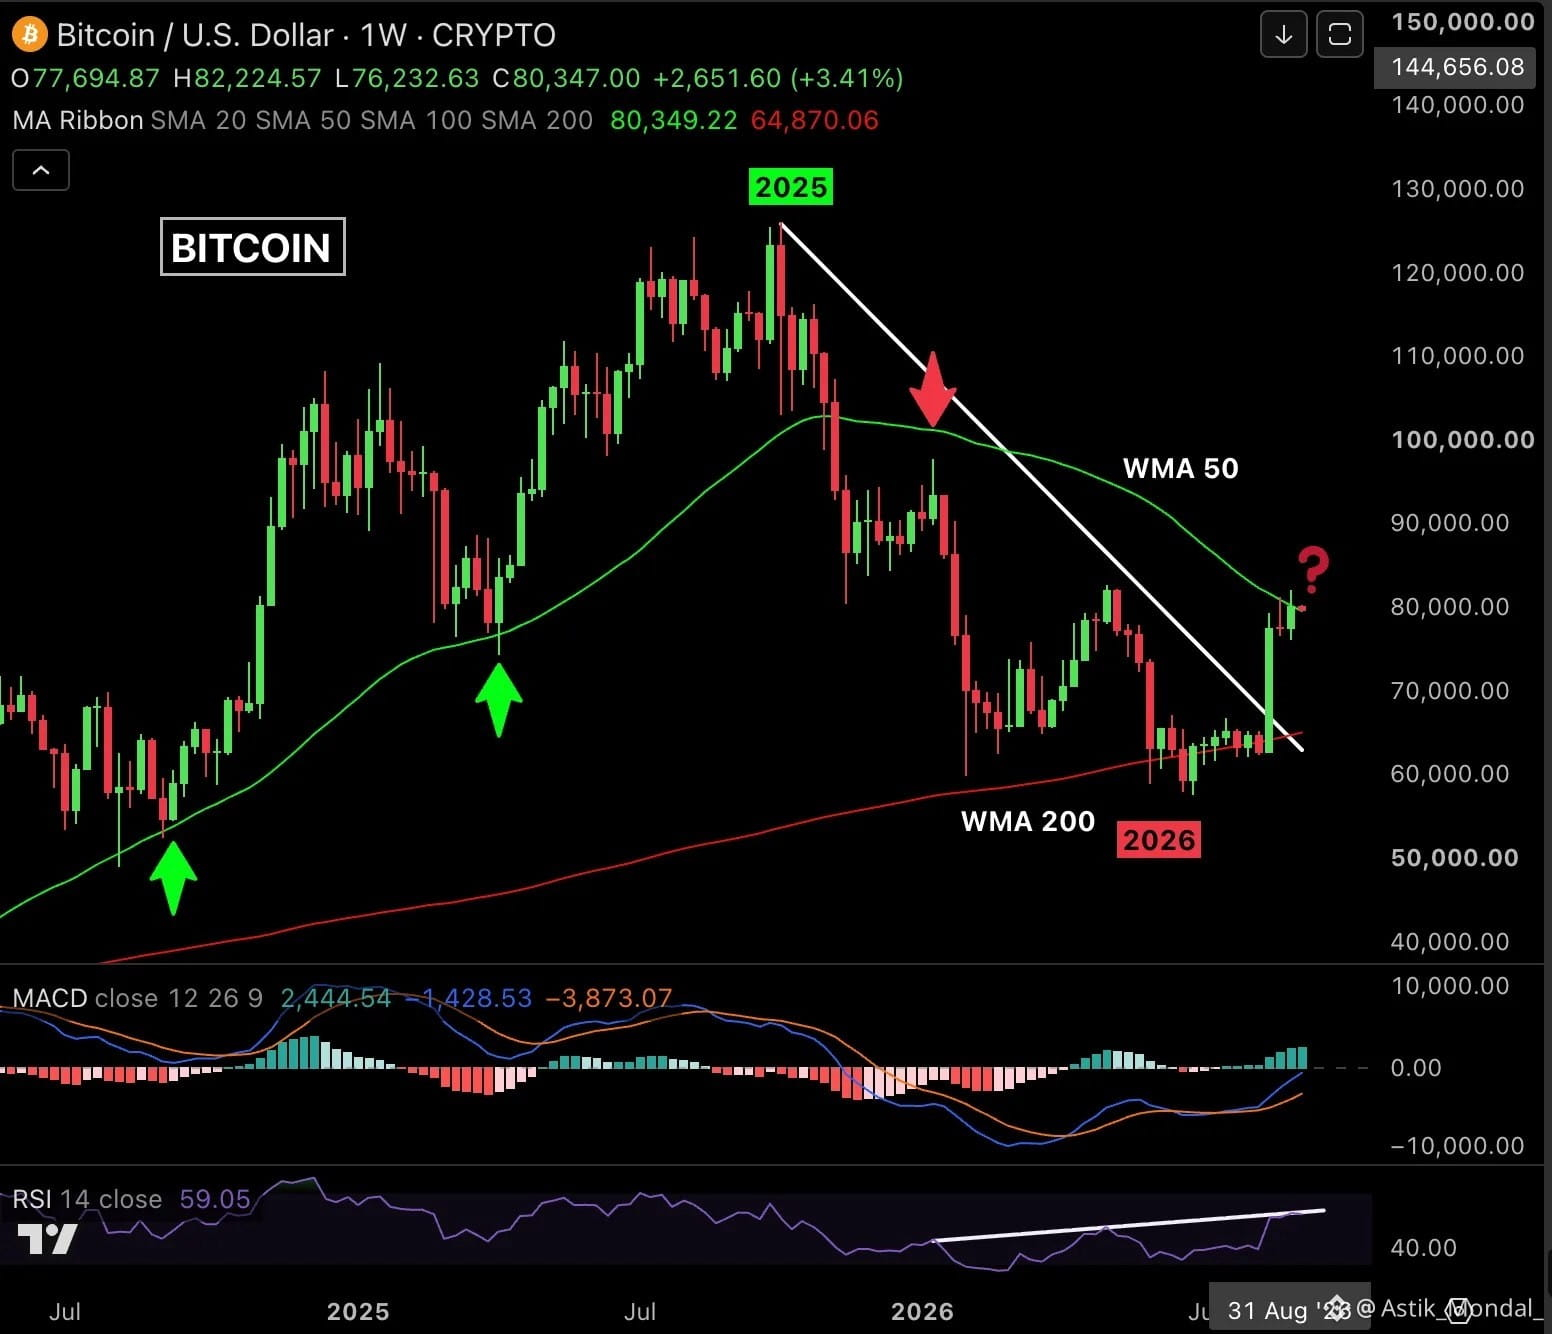
Bitcoin closed at $80,349, right on the Weekly MA 50. This is a test, not a breakout, and the chart makes the stakes obvious.
BTC is still technically inside the downtrend that's run since the 2025 top. The falling trendline connecting that peak sits right around $83,000. Until price closes a full week above it, nothing is confirmed.
The bull case has real technical backing. Weekly MACD is curling upward. RSI closed at 59, holding its own rising trendline intact since the lows. That's constructive structure, not just a bounce.
But there's a catch worth taking seriously: RSI is also showing a bearish divergence, price pushing higher while momentum fails to confirm with equal strength. That's the kind of setup that's preceded fakeouts before.
Two paths from here. Bullish: BTC holds $76,200 as a floor and closes a week above $83K, breaking the trendline and opening the door to $90K, then $98K. Bearish: BTC loses the Weekly MA 50 and slips under $76,200, putting the Weekly MA 200 near $65,000 back in play as the next real test.
The timing makes this even sharper. Bitcoin is sitting at this exact decision point heading into PPI on September 10, CPI on September 11, and the FOMC decision on September 16, three back-to-back catalysts capable of moving rate expectations and dragging BTC hard in either direction.
$83K up. $76,200 down. The next ten days likely decide which one breaks first.
#Bitcoin #BTC #TechnicalAnalysis #Crypto #FOMC
Bitcoin closed at $80,349, right on the Weekly MA 50. This is a test, not a breakout, and the chart makes the stakes obvious.
BTC is still technically inside the downtrend that's run since the 2025 top. The falling trendline connecting that peak sits right around $83,000. Until price closes a full week above it, nothing is confirmed.
The bull case has real technical backing. Weekly MACD is curling upward. RSI closed at 59, holding its own rising trendline intact since the lows. That's constructive structure, not just a bounce.
But there's a catch worth taking seriously: RSI is also showing a bearish divergence, price pushing higher while momentum fails to confirm with equal strength. That's the kind of setup that's preceded fakeouts before.
Two paths from here. Bullish: BTC holds $76,200 as a floor and closes a week above $83K, breaking the trendline and opening the door to $90K, then $98K. Bearish: BTC loses the Weekly MA 50 and slips under $76,200, putting the Weekly MA 200 near $65,000 back in play as the next real test.
The timing makes this even sharper. Bitcoin is sitting at this exact decision point heading into PPI on September 10, CPI on September 11, and the FOMC decision on September 16, three back-to-back catalysts capable of moving rate expectations and dragging BTC hard in either direction.
$83K up. $76,200 down. The next ten days likely decide which one breaks first.
#Bitcoin #BTC #TechnicalAnalysis #Crypto #FOMC