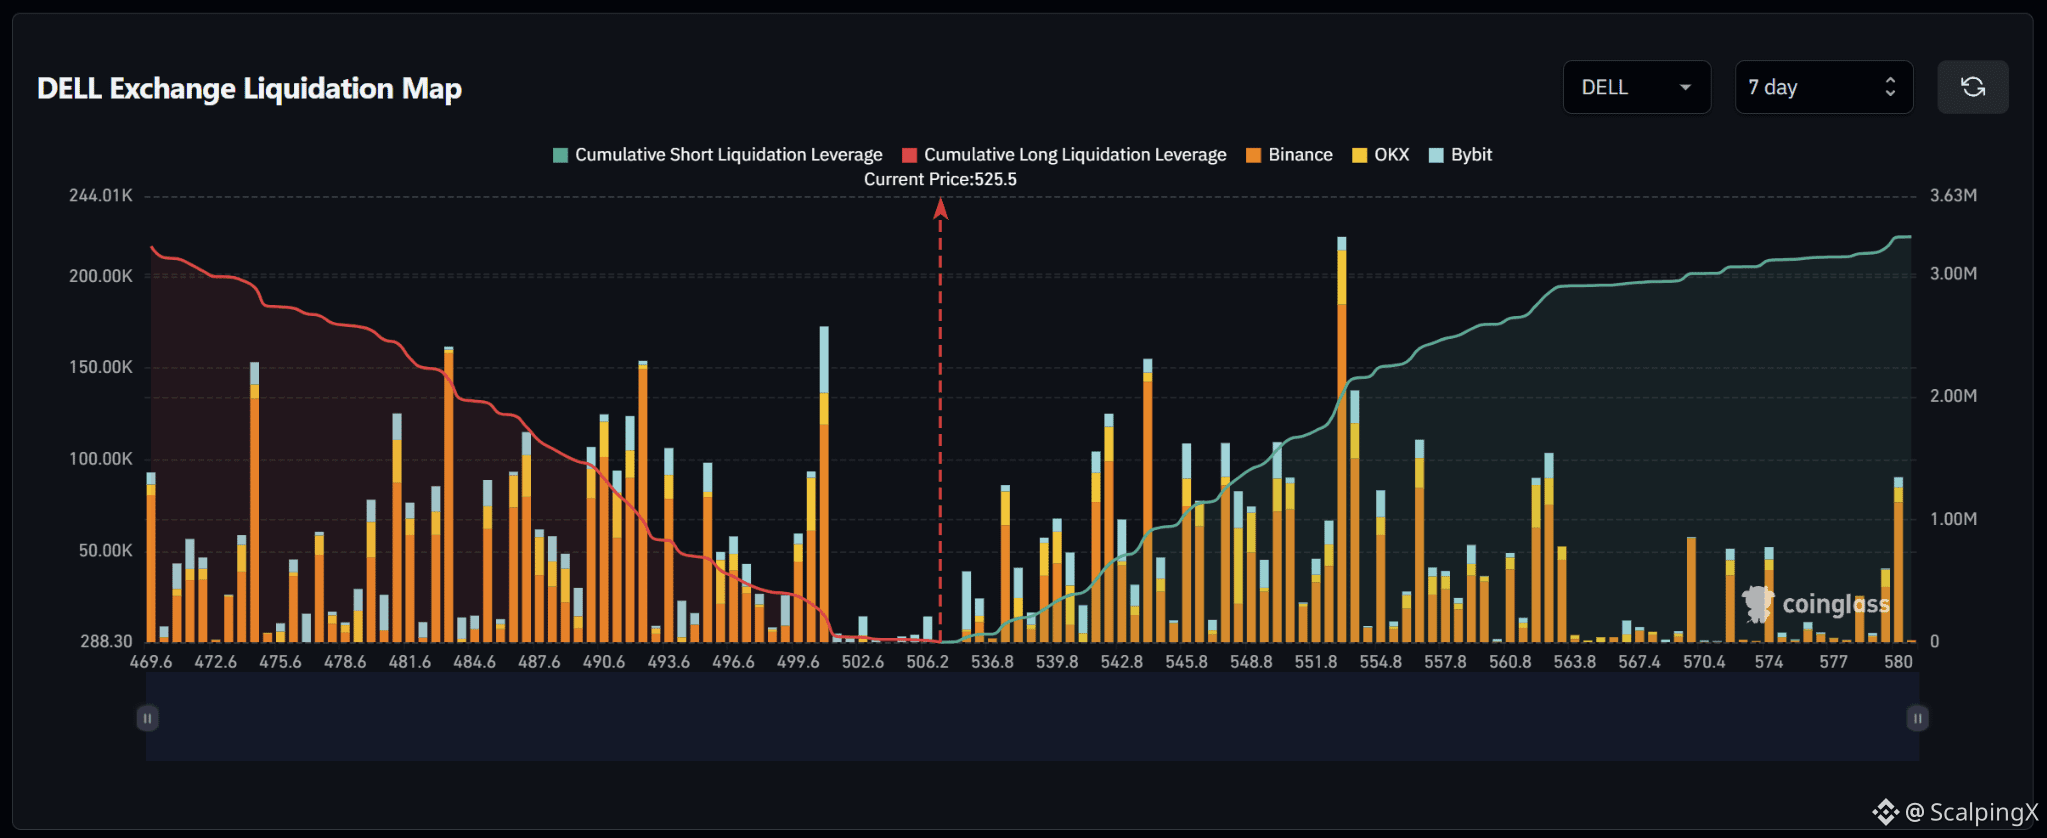
$DELL – Liquidation Map (7 Days) – Current Price 525.5
🔎 The 7-day liquidation map shows a relatively balanced liquidity structure, with both long liquidations below and short liquidations above at roughly $3.1–3.3 million. The current setup therefore does not show a strong directional imbalance based on cumulative liquidity alone.
📉 Below the market, nearby long-liquidation liquidity remains relatively thin around 506.2–502.6 before increasing sharply across 499.6–490.6. Notable clusters sit near 499.6 with a bar around $170,000, 493.6 around $150,000, and the 483–484 area with a bar close to $160,000. Losing 506.2 would shift attention toward 499.6–493.6.
📈 Above the market, short-liquidation liquidity begins building clearly from 536.8 and becomes much denser across 542.8–557.8. The strongest cluster sits near 553 with a bar above $220,000, while 543–544 also contains a bar around $150,000. Further out, 561–563 and the 580 area hold additional notable liquidity.
🧭 Overall, the setup remains fairly balanced. Breaking above 536.8 would increase the probability of a sweep toward 542.8–553, while losing 506.2 would shift attention toward 499.6–493.6.
🔎 The 7-day liquidation map shows a relatively balanced liquidity structure, with both long liquidations below and short liquidations above at roughly $3.1–3.3 million. The current setup therefore does not show a strong directional imbalance based on cumulative liquidity alone.
📉 Below the market, nearby long-liquidation liquidity remains relatively thin around 506.2–502.6 before increasing sharply across 499.6–490.6. Notable clusters sit near 499.6 with a bar around $170,000, 493.6 around $150,000, and the 483–484 area with a bar close to $160,000. Losing 506.2 would shift attention toward 499.6–493.6.
📈 Above the market, short-liquidation liquidity begins building clearly from 536.8 and becomes much denser across 542.8–557.8. The strongest cluster sits near 553 with a bar above $220,000, while 543–544 also contains a bar around $150,000. Further out, 561–563 and the 580 area hold additional notable liquidity.
🧭 Overall, the setup remains fairly balanced. Breaking above 536.8 would increase the probability of a sweep toward 542.8–553, while losing 506.2 would shift attention toward 499.6–493.6.