

#LINK A clear breakthrough has finally been seen recently. Throughout most of August, LINK encountered resistance around the $12–$12.20 range, and the price struggled to break through effectively. However, bulls have recently stepped up, and LINK has successfully moved above this resistance area. The price is now above $13 and once approached $13.68.
For ordinary investors, breaking through a resistance level can be simply understood as this: the spot that had been hard to sell at before has now finally been overcome by buyers. If LINK can hold steadily above $12–$12.20, it means this area has the potential to turn from a "resistance level" into a new "support level," which is a place where buying may emerge if the price falls.
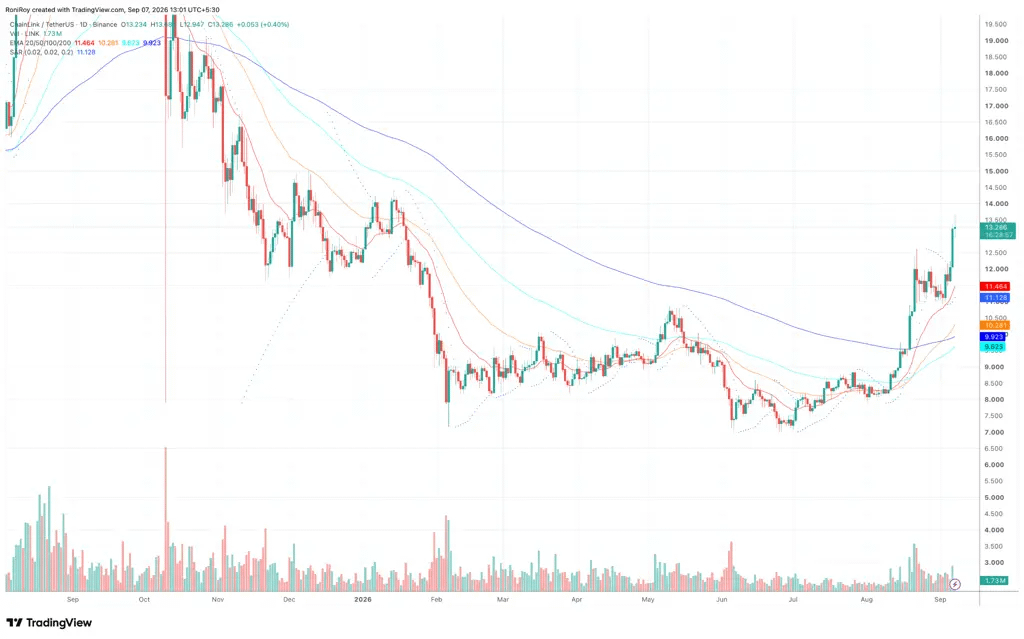
From the overall trend, LINK is still relatively strong. The 20-day moving average is at $11.46, the 50-day moving average is at $10.28, and the 200-day moving average is about $9.92. All of these major moving averages are currently below LINK’s price. In simple terms, the short-, medium-, and long-term average prices are all below the current price, indicating that the market is still in an uptrend.
In addition, LINK had previously lingered near the 200-day moving average for quite some time, and its renewed breakout has further strengthened market confidence in a bullish move. At the same time, recent trading volume has increased significantly, suggesting that this rally is not just a simple price increase, but one with more capital participating in buying, making the breakout relatively more credible.
In the short term, the area around $13.68 is the key level to watch right now. If LINK can break above this recent high and hold there, the next move could point toward $14. $14 is a fairly important psychological level, and once broken, the market may make another push toward the $15–$15.50 area.
Of course, the faster the rise, the more attention should be paid to correction risk. The most important defense zone right now is still $12–$12.20. If the price falls back here, it suggests this breakout may not be solid enough. If it then breaks below $12, the next area to watch is around the 20-day moving average near $11.46. If that level also fails to hold, the next support is around $10.28.
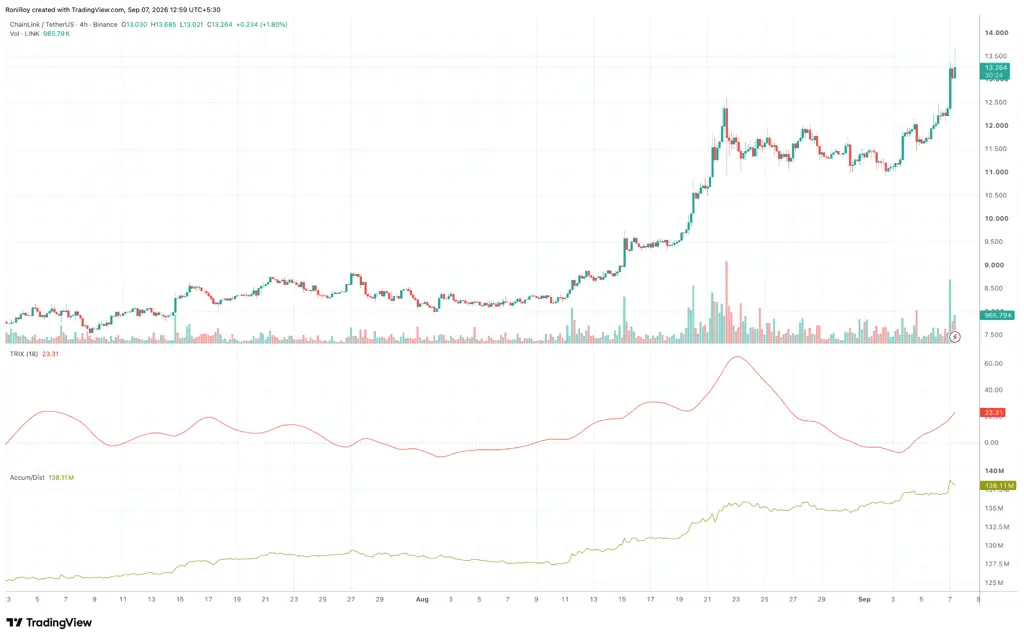
Also, from a short-term momentum perspective, LINK is still rising relatively quickly. But if momentum starts to fade later and the price still cannot break above $13.68, we should be alert to the possibility that the upward move is beginning to slow.
In simple terms: LINK’s overall trend is still bullish. $12–$12.20 is the key support, $13.68 is the short-term breakout level, and $14 is the next target. If it breaks above $14, you can then watch $15–$15.50. But if it falls below $12, be cautious that this breakout may have failed, and the market could return to a range.