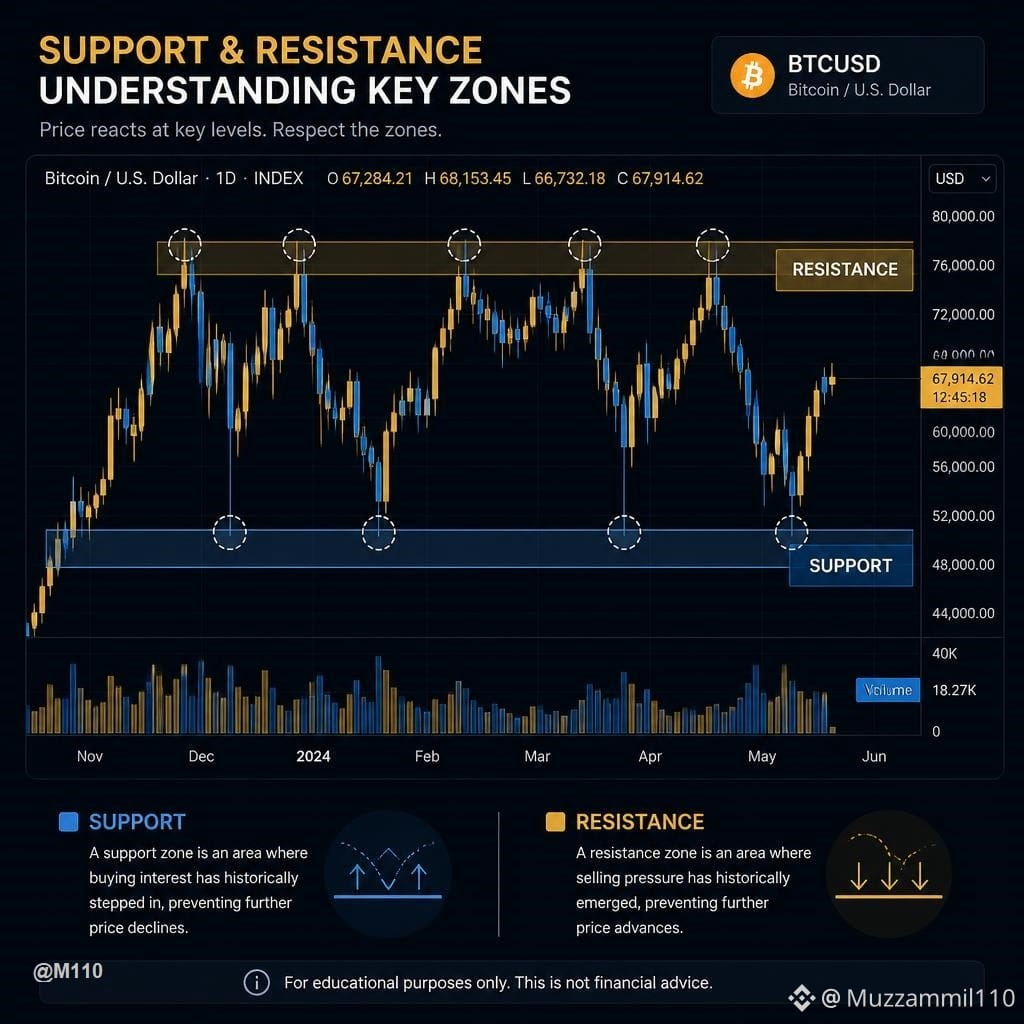
📊 Support & Resistance: Why These Levels Matter More Than Random Price Targets
When studying a crypto chart, it's easy to focus on a specific price target.
But before thinking about where price might go, it's often more useful to understand where price has previously reacted.
That's where support and resistance come in.
🔹 Support
A price area where buying interest has previously helped slow or stop a decline.
🔹 Resistance
A price area where selling pressure has previously slowed or stopped an advance.
🔹 Why Are They Important?
These aren't magic numbers.
They are areas where traders and market participants have previously shown interest. The more clearly a level has been respected, the more useful it can be as part of your chart analysis.
🔹 Levels vs. Exact Lines
Beginners often draw one perfect line.
In reality, support and resistance are often better viewed as zones because price can move slightly above or below an area before reacting.
🔹 Context Matters
A level should not be analyzed in isolation.
Consider:
• Market structure
• Volume
• Previous reactions
• Timeframe
• Overall market conditions
📌 Beginner takeaway:
Instead of asking:
"What's the next random price target?"
Start by asking:
"Where has the market previously shown strong interest?"
That simple change can make chart analysis much more structured.
$BTC
This is educational content, not a trading signal or financial advice.
💬 When analyzing a chart, do you focus more on support, resistance, or both?
Daily crypto thoughts for calm decision-makers — follow
#Marketstructure #tradingeducation #CryptoTrading #CryptoWithAli #BinanceSquare
When studying a crypto chart, it's easy to focus on a specific price target.
But before thinking about where price might go, it's often more useful to understand where price has previously reacted.
That's where support and resistance come in.
🔹 Support
A price area where buying interest has previously helped slow or stop a decline.
🔹 Resistance
A price area where selling pressure has previously slowed or stopped an advance.
🔹 Why Are They Important?
These aren't magic numbers.
They are areas where traders and market participants have previously shown interest. The more clearly a level has been respected, the more useful it can be as part of your chart analysis.
🔹 Levels vs. Exact Lines
Beginners often draw one perfect line.
In reality, support and resistance are often better viewed as zones because price can move slightly above or below an area before reacting.
🔹 Context Matters
A level should not be analyzed in isolation.
Consider:
• Market structure
• Volume
• Previous reactions
• Timeframe
• Overall market conditions
📌 Beginner takeaway:
Instead of asking:
"What's the next random price target?"
Start by asking:
"Where has the market previously shown strong interest?"
That simple change can make chart analysis much more structured.
$BTC
This is educational content, not a trading signal or financial advice.
💬 When analyzing a chart, do you focus more on support, resistance, or both?
Daily crypto thoughts for calm decision-makers — follow
#Marketstructure #tradingeducation #CryptoTrading #CryptoWithAli #BinanceSquare