Everyone watching the bounce, but the 15m RSI is screaming something different.
$META /USDT - 🟢 SHORT · Conf 85%
Trade Plan:
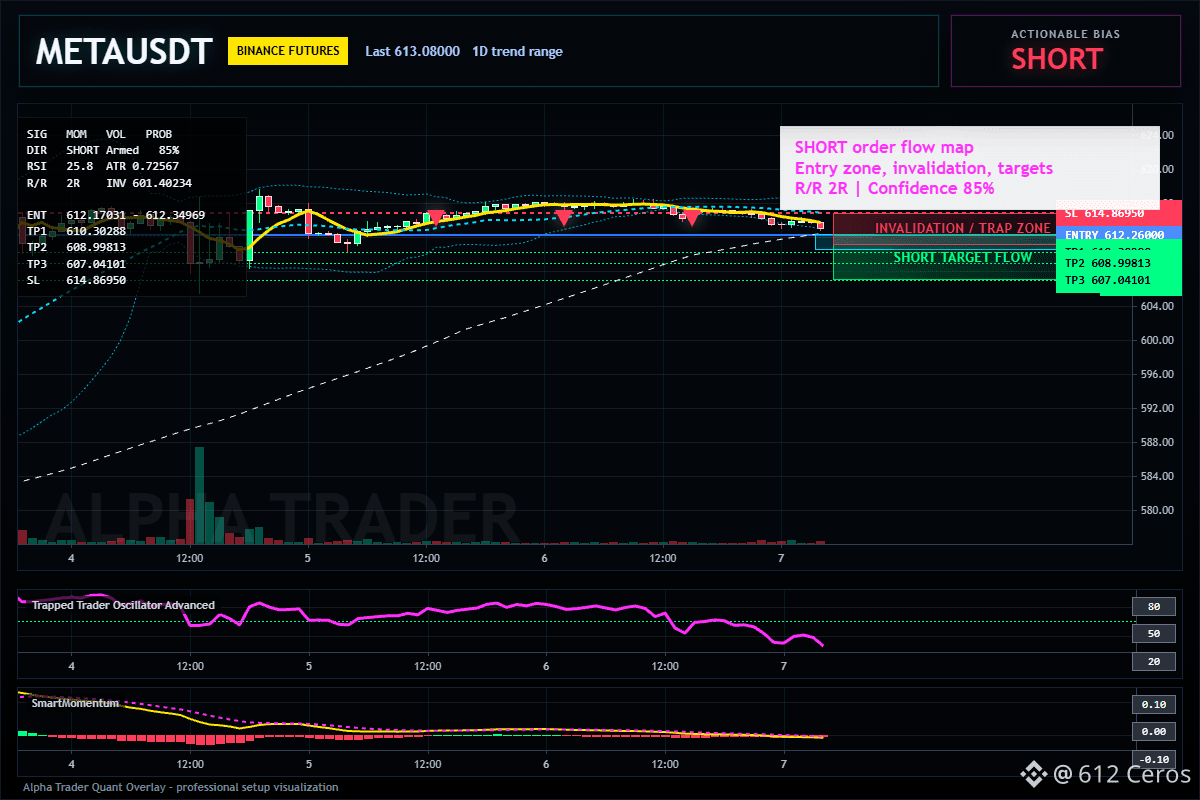
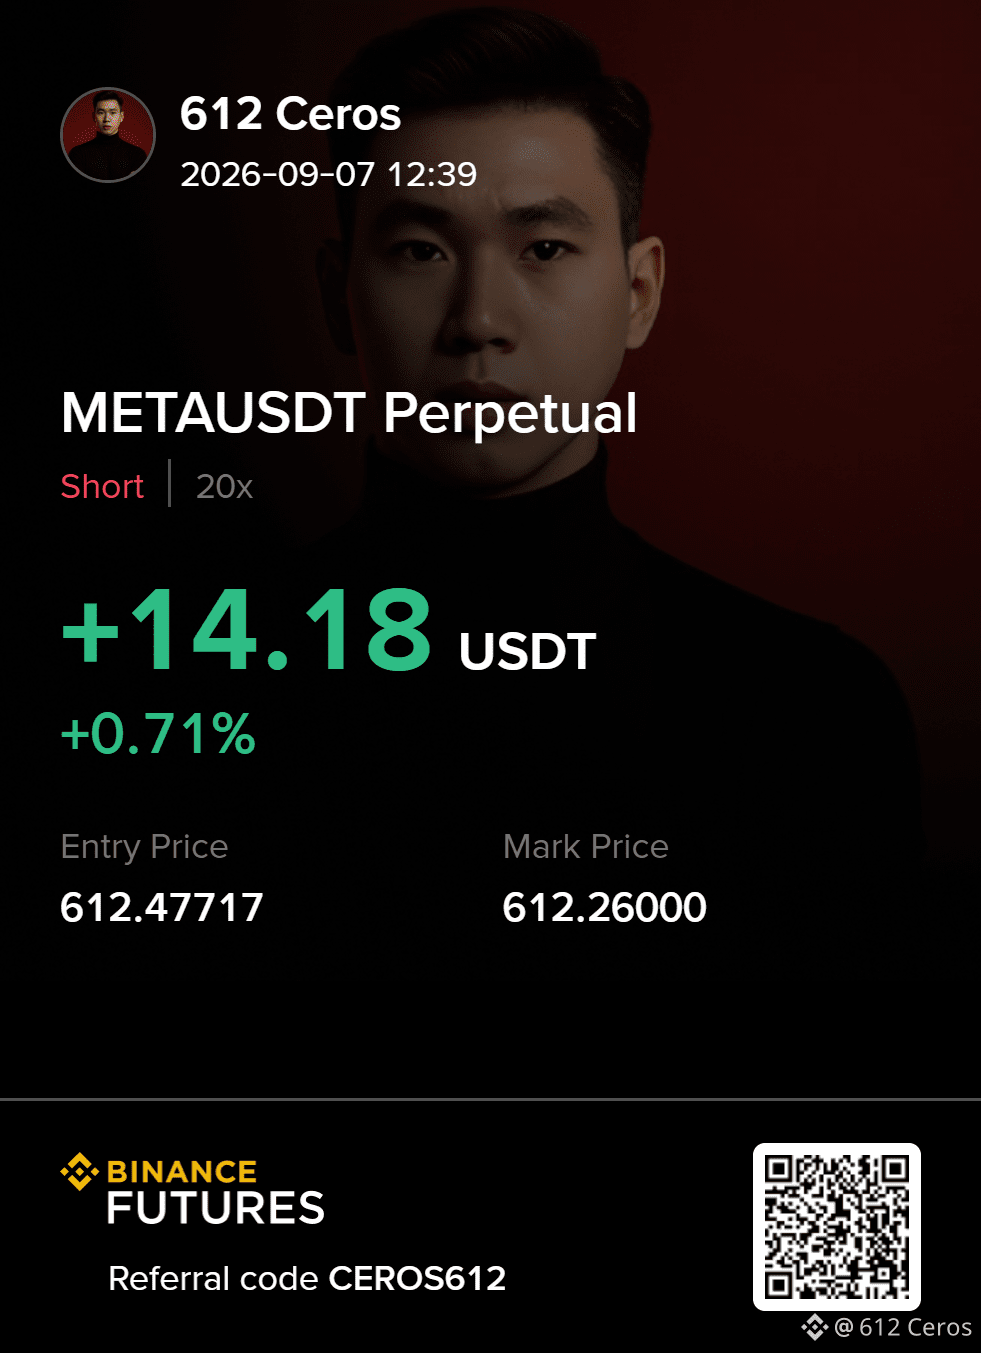
Entry: 612.17031 – 612.34969
SL: 614.86950
TP1: 610.30288
TP2: 608.99813
TP3: 607.04101
Why this setup?
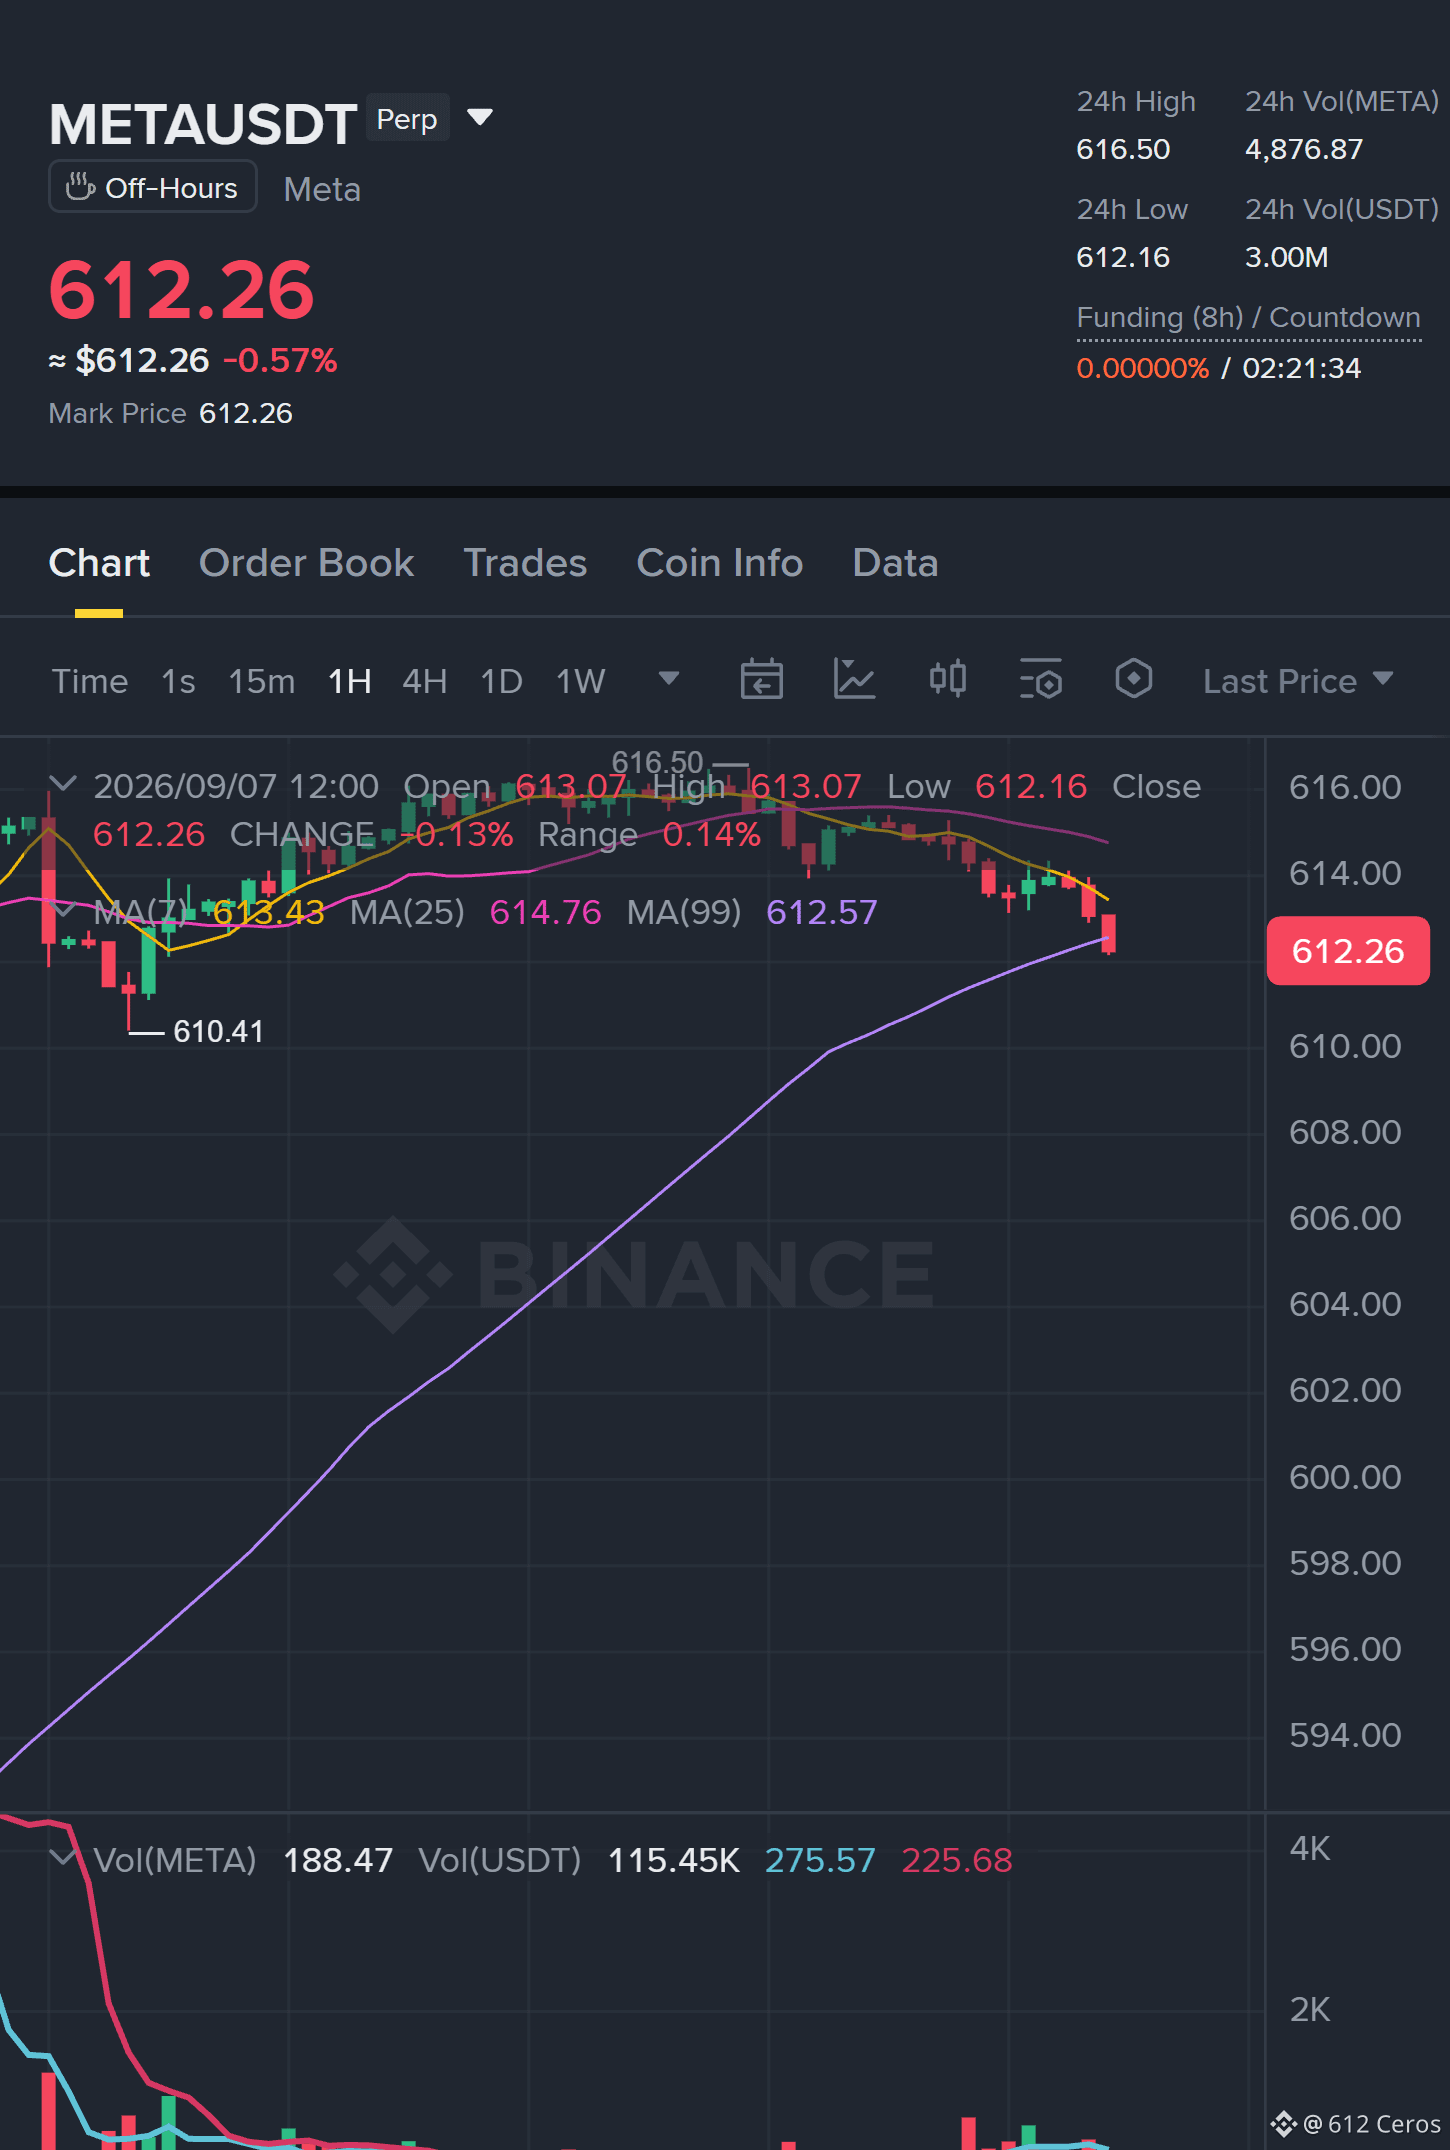
Why now? The 1h price is sitting at 612.26, right inside the entry zone between 612.17 and 612.35, while the 15m RSI has dropped to 25.82, signaling exhaustion after the move down. The 1h ATR of 0.725668 defines the volatility envelope, so a break of 614.87 invalidates the short and the daily range structure keeps this from being a counter-trend gamble. The first target is 610.30, followed by 608.99, with the line in the sand drawn at 601.40 for the trade to remain valid.
Debate:
Are we testing 608.99 or is the range about to snap back up?
Click here to view the chart 👇️
⚠️ Personal market analysis only. NFA — manage risk and DYOR.
Educational content, not investment advice or a recommendation to buy, sell, deposit, or withdraw any asset. No paid promotion or referral/affiliate links.
$META /USDT - 🟢 SHORT · Conf 85%
Trade Plan:
Entry: 612.17031 – 612.34969
SL: 614.86950
TP1: 610.30288
TP2: 608.99813
TP3: 607.04101
Why this setup?
Why now? The 1h price is sitting at 612.26, right inside the entry zone between 612.17 and 612.35, while the 15m RSI has dropped to 25.82, signaling exhaustion after the move down. The 1h ATR of 0.725668 defines the volatility envelope, so a break of 614.87 invalidates the short and the daily range structure keeps this from being a counter-trend gamble. The first target is 610.30, followed by 608.99, with the line in the sand drawn at 601.40 for the trade to remain valid.
Debate:
Are we testing 608.99 or is the range about to snap back up?
Click here to view the chart 👇️
⚠️ Personal market analysis only. NFA — manage risk and DYOR.
Educational content, not investment advice or a recommendation to buy, sell, deposit, or withdraw any asset. No paid promotion or referral/affiliate links.