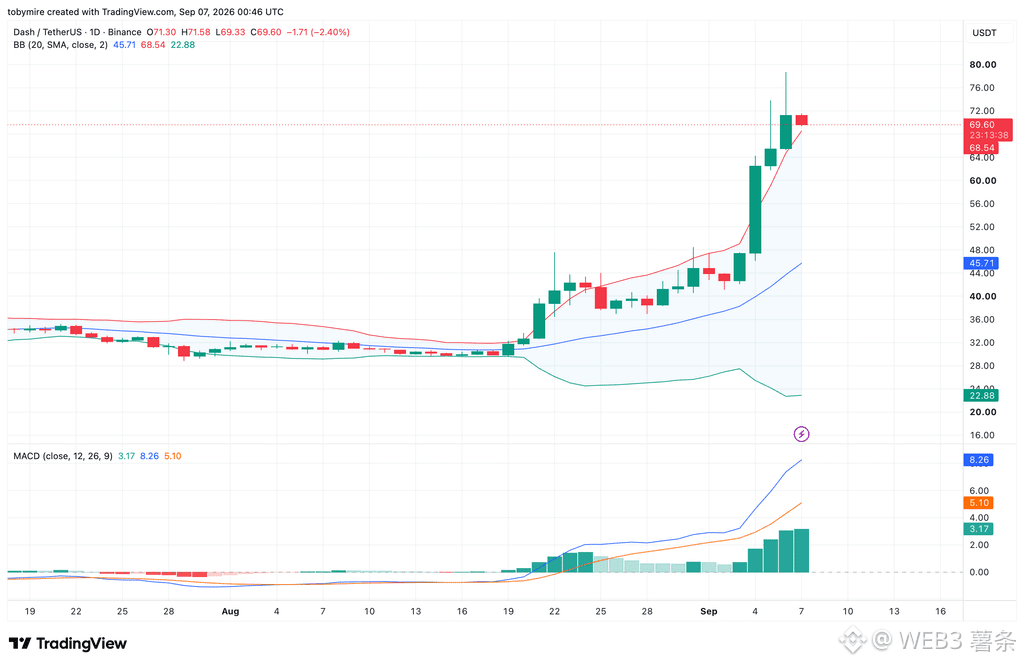
As of September 7, #DASH was priced at about $69.60, down 2.40% on the day, after briefly reaching an intraday high of $71.58.
Although there was a slight pullback today, the overall trend shows that DASH has remained relatively strong recently. The price had previously risen steadily from around $40, indicating that market buying interest is still fairly active. The MACD indicator is still in positive territory, meaning short-term bullish momentum still has the upper hand for now.
However, DASH is also facing a problem: the price has risen quite quickly, and in the short term there is a sense that it has gone up too much and needs a pause. Simply put, some investors who bought earlier may choose to take profits, which could create pullback pressure.
At present, the key area to watch is $65–68. If the price can hold above this zone, the overall uptrend will not be broken for the time being. If it later breaks above $72 with volume, there is a chance it could continue moving toward the $78–80 area.
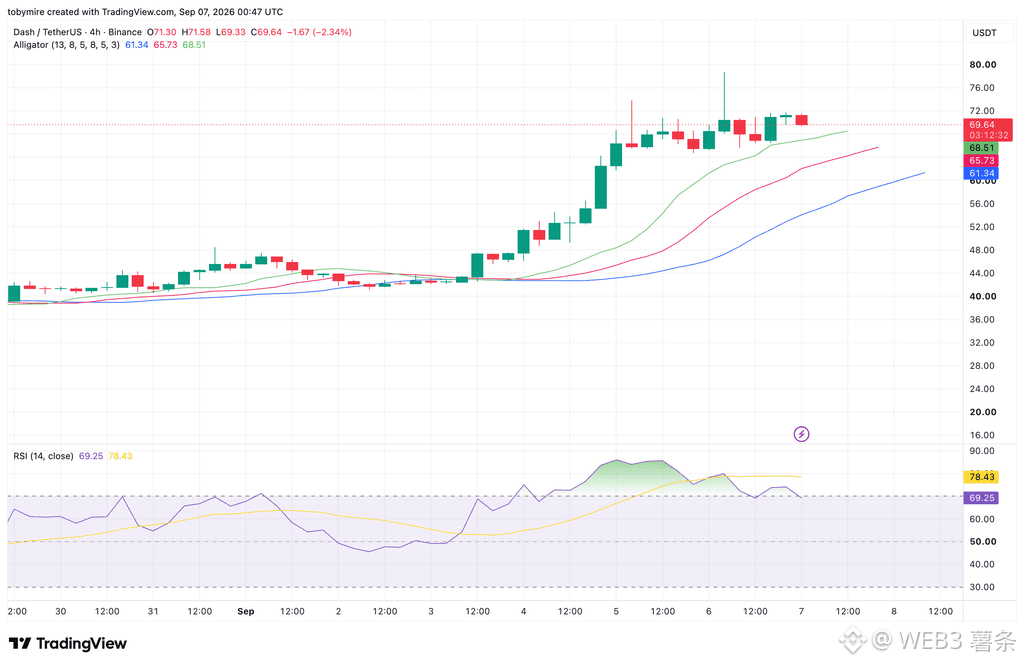
From the 4-hour chart, DASH is currently fluctuating mainly around $69. The RSI has fallen from its previous high to 69.25, indicating that market enthusiasm has cooled somewhat, but there is still no clear sign of weakness.
Therefore, in the short term, two levels deserve close attention: $72 is the key resistance for an upside breakout, while $68.50 is an important support level. A break above $72 could open up new upside room; if $68.50 is broken to the downside, caution is needed for a further pullback toward around $65.70.
Overall, DASH remains relatively strong in the short term, but after the rapid rise, the risk of chasing highs is also increasing. Investors should pay attention to key support levels and whether a breakout occurs.#BTC触及80000美元
Although there was a slight pullback today, the overall trend shows that DASH has remained relatively strong recently. The price had previously risen steadily from around $40, indicating that market buying interest is still fairly active. The MACD indicator is still in positive territory, meaning short-term bullish momentum still has the upper hand for now.
However, DASH is also facing a problem: the price has risen quite quickly, and in the short term there is a sense that it has gone up too much and needs a pause. Simply put, some investors who bought earlier may choose to take profits, which could create pullback pressure.
At present, the key area to watch is $65–68. If the price can hold above this zone, the overall uptrend will not be broken for the time being. If it later breaks above $72 with volume, there is a chance it could continue moving toward the $78–80 area.
From the 4-hour chart, DASH is currently fluctuating mainly around $69. The RSI has fallen from its previous high to 69.25, indicating that market enthusiasm has cooled somewhat, but there is still no clear sign of weakness.
Therefore, in the short term, two levels deserve close attention: $72 is the key resistance for an upside breakout, while $68.50 is an important support level. A break above $72 could open up new upside room; if $68.50 is broken to the downside, caution is needed for a further pullback toward around $65.70.
Overall, DASH remains relatively strong in the short term, but after the rapid rise, the risk of chasing highs is also increasing. Investors should pay attention to key support levels and whether a breakout occurs.#BTC触及80000美元