Multiple coins soaring together, 30-minute volume surge driving prices up, 4-hour trend has already stabilized 🔥
════════════════════
🔴 $HOOD 30-minute bullish signal
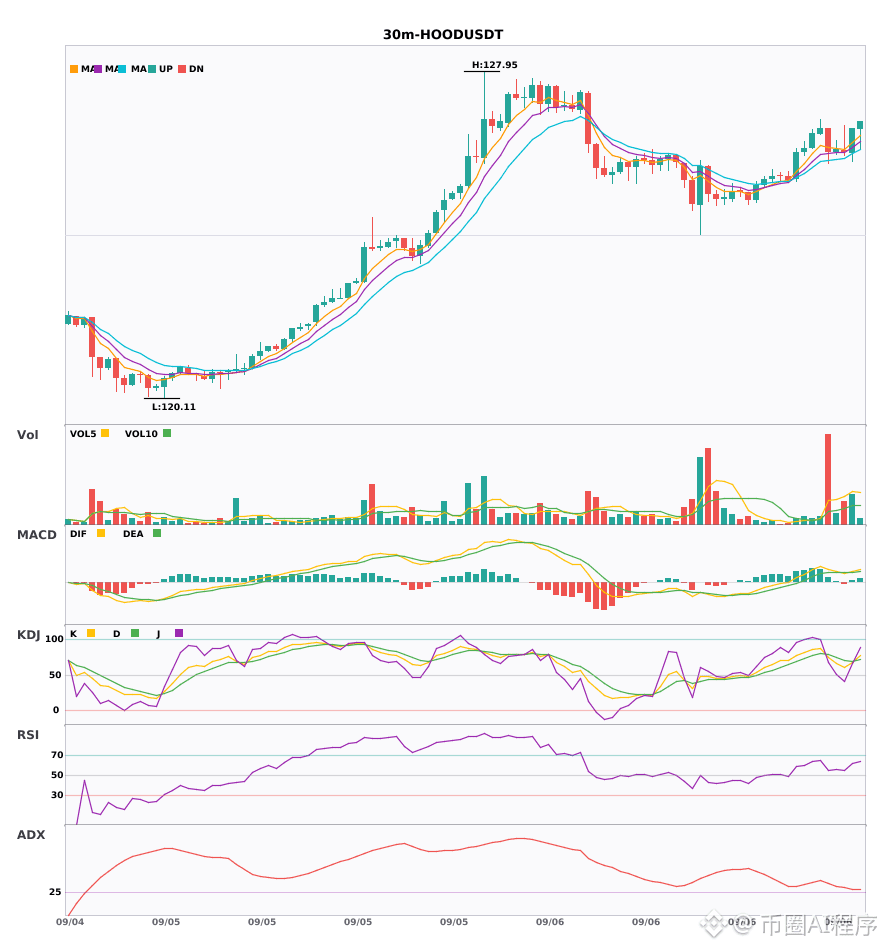
⚠️Technical analysis: The 4-hour trend is bullish overall, a buy point has appeared on the 30-minute chart, after the MACD golden cross above the zero line the red histogram has lengthened, the 5/8/13 moving averages have just formed a bullish alignment, and the KDJ golden cross has not yet reached overbought territory. Multiple timeframes are resonating, so it’s a valid entry.
════════════════════
🔴 $PHA 30-minute bullish signal
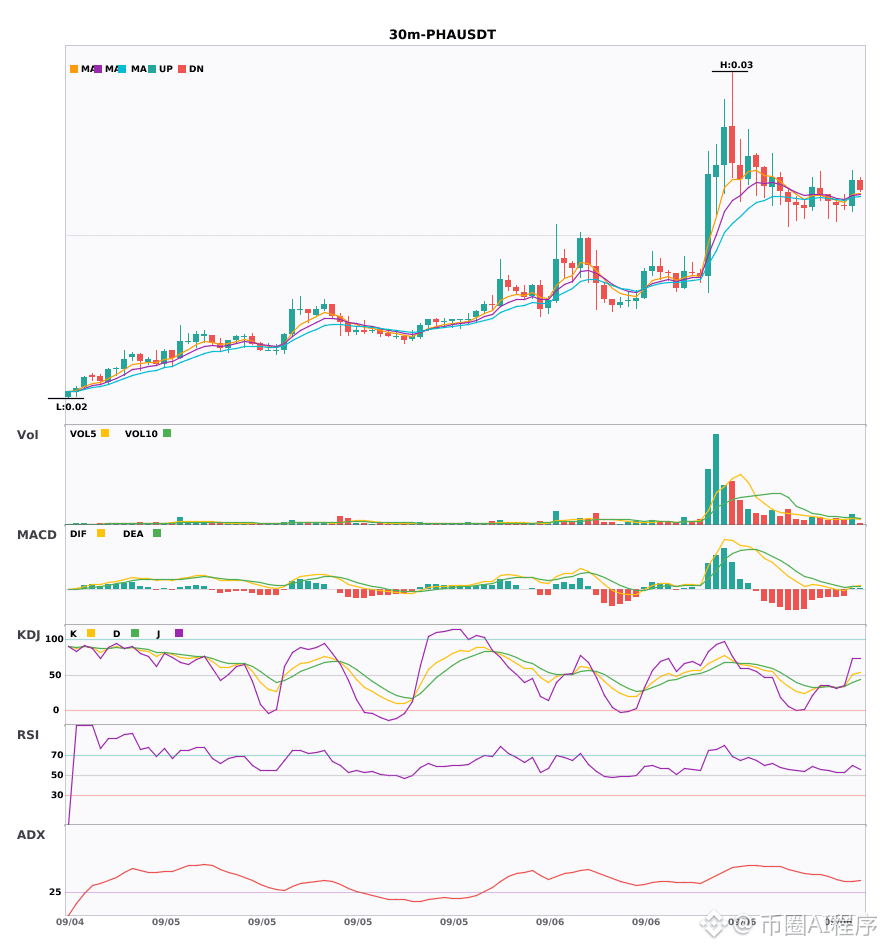
⚠️Technical analysis: The 4-hour trend is bullish overall, the 30-minute MACD golden cross is above the zero line, the red histogram is lengthening with momentum catching up, the 5-day moving average has just crossed above the 8-day moving average, and volume is sufficient. Multiple timeframes are confirming the entry signal together.
════════════════════
🔴 $ESP 30-minute bullish signal
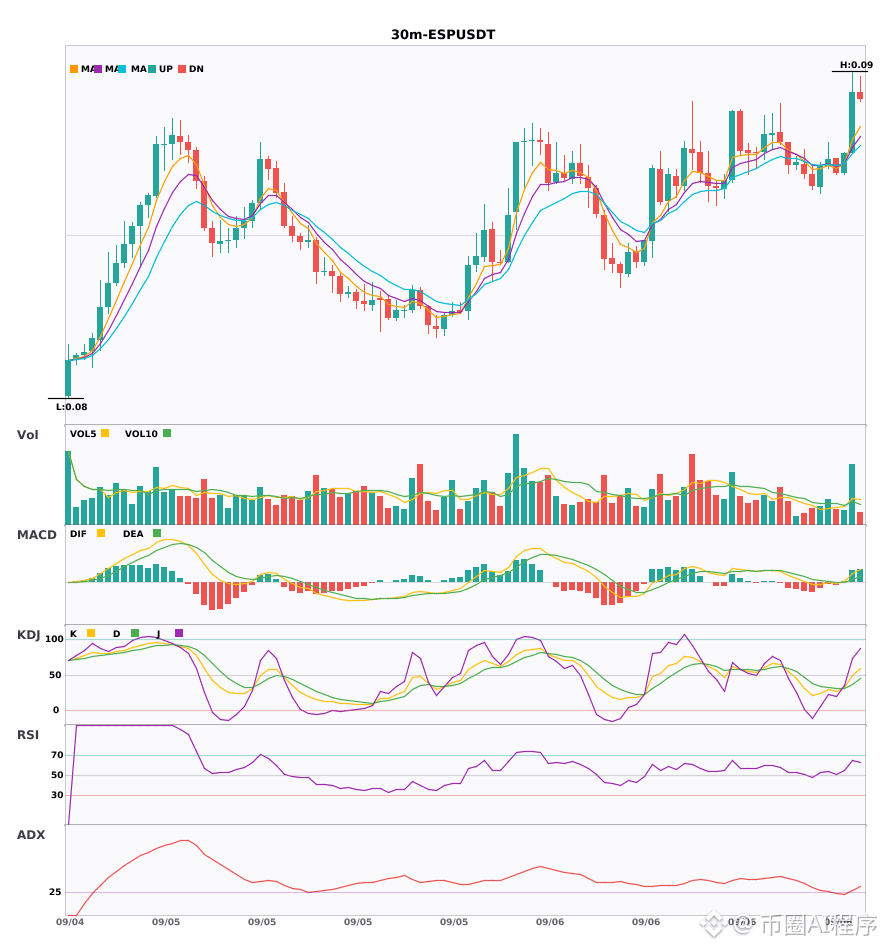
⚠️Technical analysis: On the 30-minute chart, after the MACD golden cross, the red histogram continues to expand, showing short-term strength; the 4-hour trend is also in a bullish alignment and expanding upward. Multiple timeframes are resonating to confirm the entry signal, and volume is also expanding in sync, so you can follow with a long position.
════════════════════
🔔 Follow for the latest first-hand market moves 🔔
#多周期共振 #HOOD #PHA #ESP
📌 When trading, pay attention to whether the candlestick pattern is consistent
════════════════════
🔴 $HOOD 30-minute bullish signal
⚠️Technical analysis: The 4-hour trend is bullish overall, a buy point has appeared on the 30-minute chart, after the MACD golden cross above the zero line the red histogram has lengthened, the 5/8/13 moving averages have just formed a bullish alignment, and the KDJ golden cross has not yet reached overbought territory. Multiple timeframes are resonating, so it’s a valid entry.
════════════════════
🔴 $PHA 30-minute bullish signal
⚠️Technical analysis: The 4-hour trend is bullish overall, the 30-minute MACD golden cross is above the zero line, the red histogram is lengthening with momentum catching up, the 5-day moving average has just crossed above the 8-day moving average, and volume is sufficient. Multiple timeframes are confirming the entry signal together.
════════════════════
🔴 $ESP 30-minute bullish signal
⚠️Technical analysis: On the 30-minute chart, after the MACD golden cross, the red histogram continues to expand, showing short-term strength; the 4-hour trend is also in a bullish alignment and expanding upward. Multiple timeframes are resonating to confirm the entry signal, and volume is also expanding in sync, so you can follow with a long position.
════════════════════
🔔 Follow for the latest first-hand market moves 🔔
#多周期共振 #HOOD #PHA #ESP
📌 When trading, pay attention to whether the candlestick pattern is consistent