
$BTC THE BIG QUESTION: WHO IS STILL SHORTING?
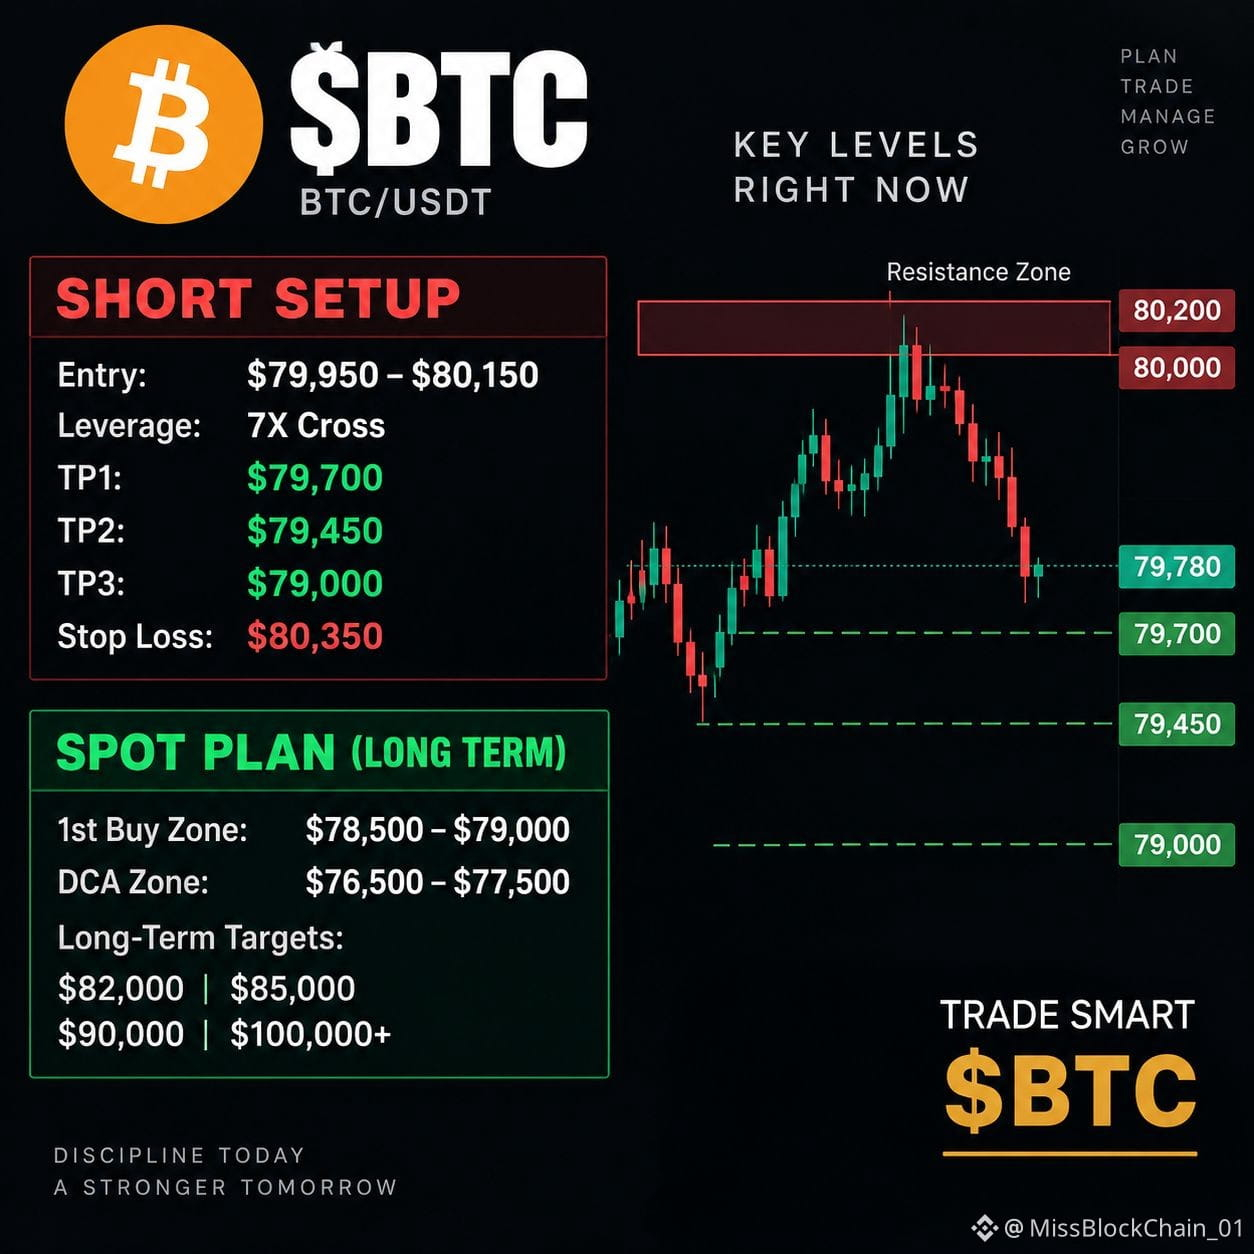
Bitcoin is currently trading around $79,780 after rejecting the $80,100–$80,200 area. The 15M chart shows short-term weakness after the sharp rejection, with sellers pushing price back toward the $79,700 support zone.
The key battle is now between $79,700 support and the $80,000–$80,200 resistance zone. A clean rejection can bring another downside move, while a strong breakout above $80,200 could invalidate the bearish setup.
SHORT-TERM BEARISH SETUP
BTC SHORT
Entry: $79,950–$80,150
Leverage: 7X Cross
TP1: $79,700
TP2: $79,450
TP3: $79,000
Stop Loss: $80,350
Why this setup?
BTC has faced repeated rejection near the $80K psychological level, and the latest move shows short-term selling pressure. If $79,700 breaks with momentum, the next downside levels can come into focus.
LONG-TERM SPOT PLAN
For long-term BTC believers, I would avoid chasing the price directly into resistance and instead watch deeper pullbacks for accumulation.
1st Buy Zone: $78,500–$79,000
DCA Zone: $76,500–$77,500
Long-Term Targets:
$82,000
$85,000
$90,000
$100,000+
Bitcoin remains the strongest asset in the crypto market, with a fixed maximum supply of 21 million BTC and a long-term scarcity narrative similar to digital gold.
But remember: even strong assets can experience sharp corrections. Never use excessive leverage, and always manage your position size and invalidation level.
So tell me:
WHO IS SHORTING $BTC FROM THE $80,000–$80,200 AREA?
Are we heading toward $79,700 → $79,450 → $79,000, or will BTC break $80,200 and start the next move toward $82K+?
Drop your thoughts in the comments.
Follow for more high-quality BTC setups, market updates and important levels.
Trade $BTC here low-fee trading available.
Bitcoin is currently trading around $79,780 after rejecting the $80,100–$80,200 area. The 15M chart shows short-term weakness after the sharp rejection, with sellers pushing price back toward the $79,700 support zone.
The key battle is now between $79,700 support and the $80,000–$80,200 resistance zone. A clean rejection can bring another downside move, while a strong breakout above $80,200 could invalidate the bearish setup.
SHORT-TERM BEARISH SETUP
BTC SHORT
Entry: $79,950–$80,150
Leverage: 7X Cross
TP1: $79,700
TP2: $79,450
TP3: $79,000
Stop Loss: $80,350
Why this setup?
BTC has faced repeated rejection near the $80K psychological level, and the latest move shows short-term selling pressure. If $79,700 breaks with momentum, the next downside levels can come into focus.
LONG-TERM SPOT PLAN
For long-term BTC believers, I would avoid chasing the price directly into resistance and instead watch deeper pullbacks for accumulation.
1st Buy Zone: $78,500–$79,000
DCA Zone: $76,500–$77,500
Long-Term Targets:
$82,000
$85,000
$90,000
$100,000+
Bitcoin remains the strongest asset in the crypto market, with a fixed maximum supply of 21 million BTC and a long-term scarcity narrative similar to digital gold.
But remember: even strong assets can experience sharp corrections. Never use excessive leverage, and always manage your position size and invalidation level.
So tell me:
WHO IS SHORTING $BTC FROM THE $80,000–$80,200 AREA?
Are we heading toward $79,700 → $79,450 → $79,000, or will BTC break $80,200 and start the next move toward $82K+?
Drop your thoughts in the comments.
Follow for more high-quality BTC setups, market updates and important levels.
Trade $BTC here low-fee trading available.