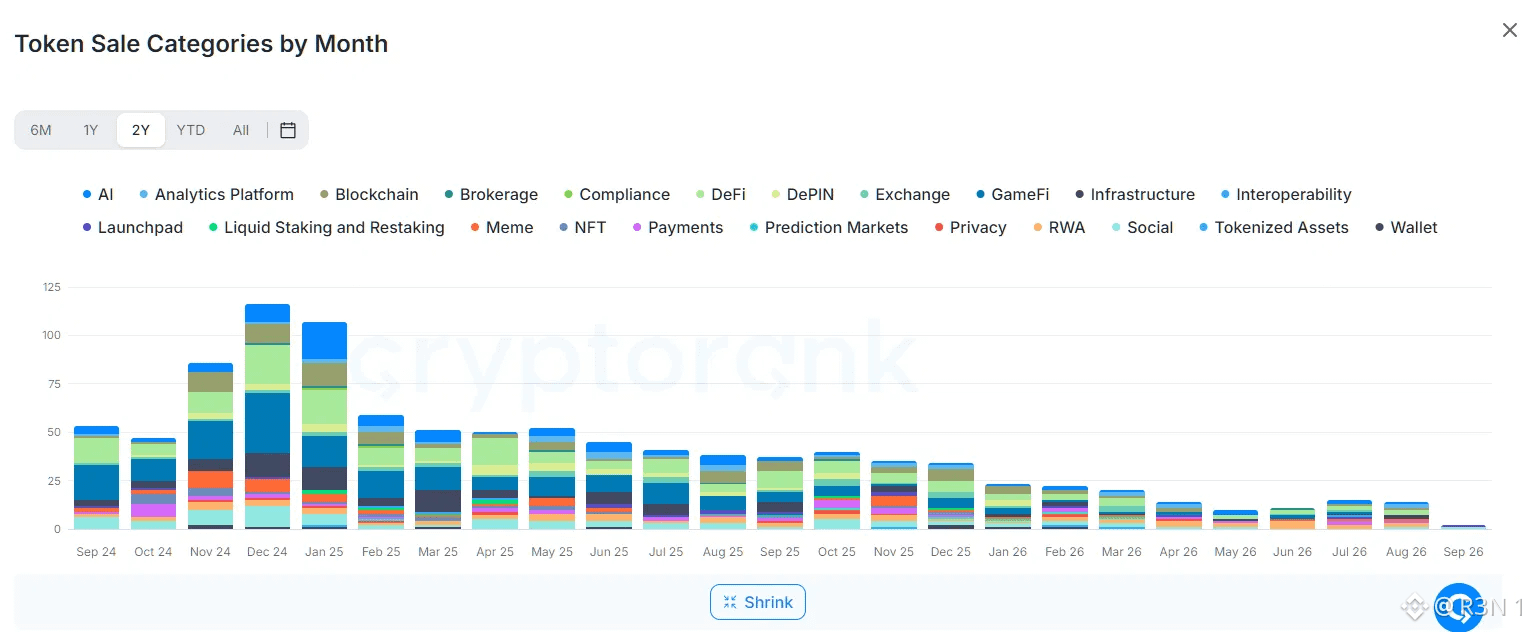
$115M+ a month at the end of 2024. A rounding error by September this year. That's the actual headline buried under the AI framing. Two years of token sale data, sorted by category, and the story isn't which sector won — it's that the whole mechanism cooled off hard. Whatever was fueling those Nov-Jan '24 bars (roughly 90-115+ combined) simply isn't there anymore. By mid-2026 the monthly totals are a fraction of that, and by September they're barely visible on the same axis. Now, the AI claim going around this chart — that it's "topped" every month for two years. I get why it looks that way; the AI segment shows up near the top of the stack in almost every bar across the whole range. But top-of-stack isn't the same as biggest-by-size in a stacked bar chart — the plotting order groups categories, it doesn't rank them. So I'd hold off calling AI the definitive leader every single month without the raw per-category numbers behind it. What I can say honestly is that AI-labeled sales look unusually persistent — present and visible through a period where most other categories either shrank a lot or vanished from view entirely. That persistence is the actual interesting data point, in my opinion. Not "AI wins," but "AI held on while the category that used to dominate this chart (whatever was driving Dec '24's spike) basically disappeared." Missing piece I'd want before treating this as settled: exact dollar figures by category, month over month — because right now this reads as a strong visual impression, not a confirmed ranking. #BTC Price Analysis# #Altcoin Season# $HYPE

Post

--
Disclaimer: Includes third-party opinions. No advice. Binance AI may be used without guarantee. See T&Cs.