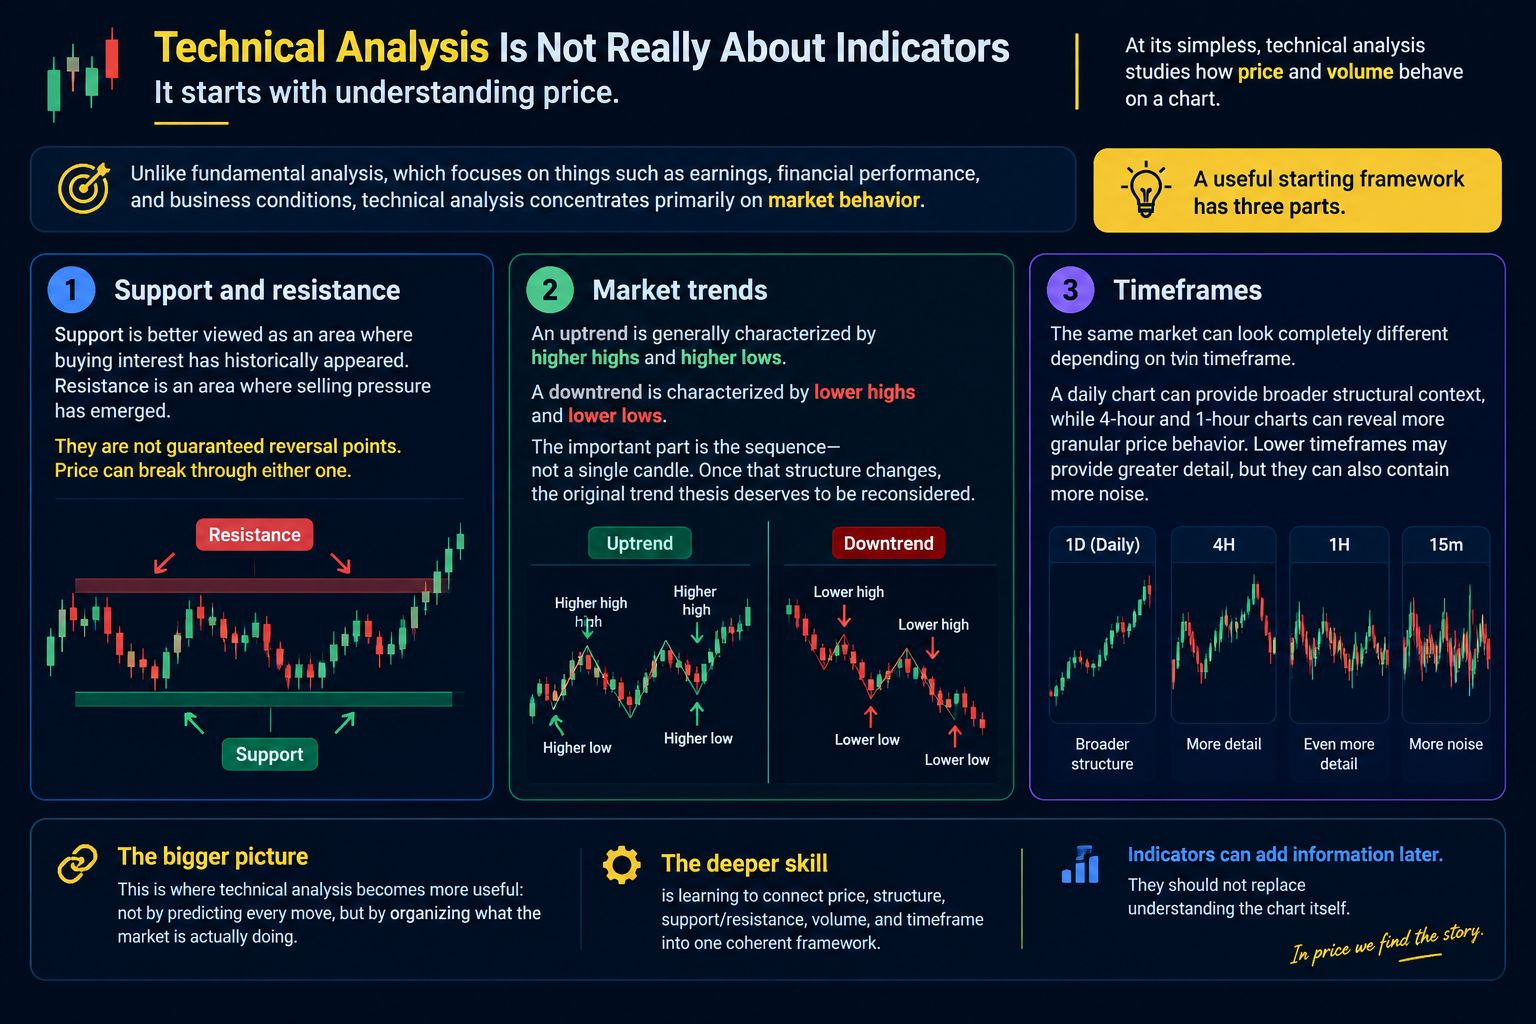

At its simplest, technical analysis studies how price and volume behave on a chart. Unlike fundamental analysis, which focuses on things such as earnings, financial performance, and business conditions, technical analysis concentrates primarily on market behavior.
A useful starting framework has three parts.
1. Support and resistance
Support is better viewed as an area where buying interest has historically appeared. Resistance is an area where selling pressure has emerged.
They are not guaranteed reversal points. Price can break through either one.
2. Market trends
An uptrend is generally characterized by higher highs and higher lows.
A downtrend is characterized by lower highs and lower lows.
The important part is the sequence—not a single candle. Once that structure changes, the original trend thesis deserves to be reconsidered.
3. Timeframes
The same market can look completely different depending on the timeframe.
A daily chart can provide broader structural context, while 4-hour and 1-hour charts can reveal more granular price behavior. Lower timeframes may provide greater detail, but they can also contain more noise.
This is where technical analysis becomes more useful: not by predicting every move, but by organizing what the market is actually doing.
The deeper skill is learning to connect price, structure, support/resistance, volume, and timeframe into one coherent framework.
Indicators can add information later. They should not replace understanding the chart itself.