
RVTS Ratio is telling a very different story across Bitcoin, Ethereum, XRP and Zcash.
RVTS uses a 28 day moving average of adjusted transaction volume, helping us compare network valuation against actual economic activity while filtering short term noise.
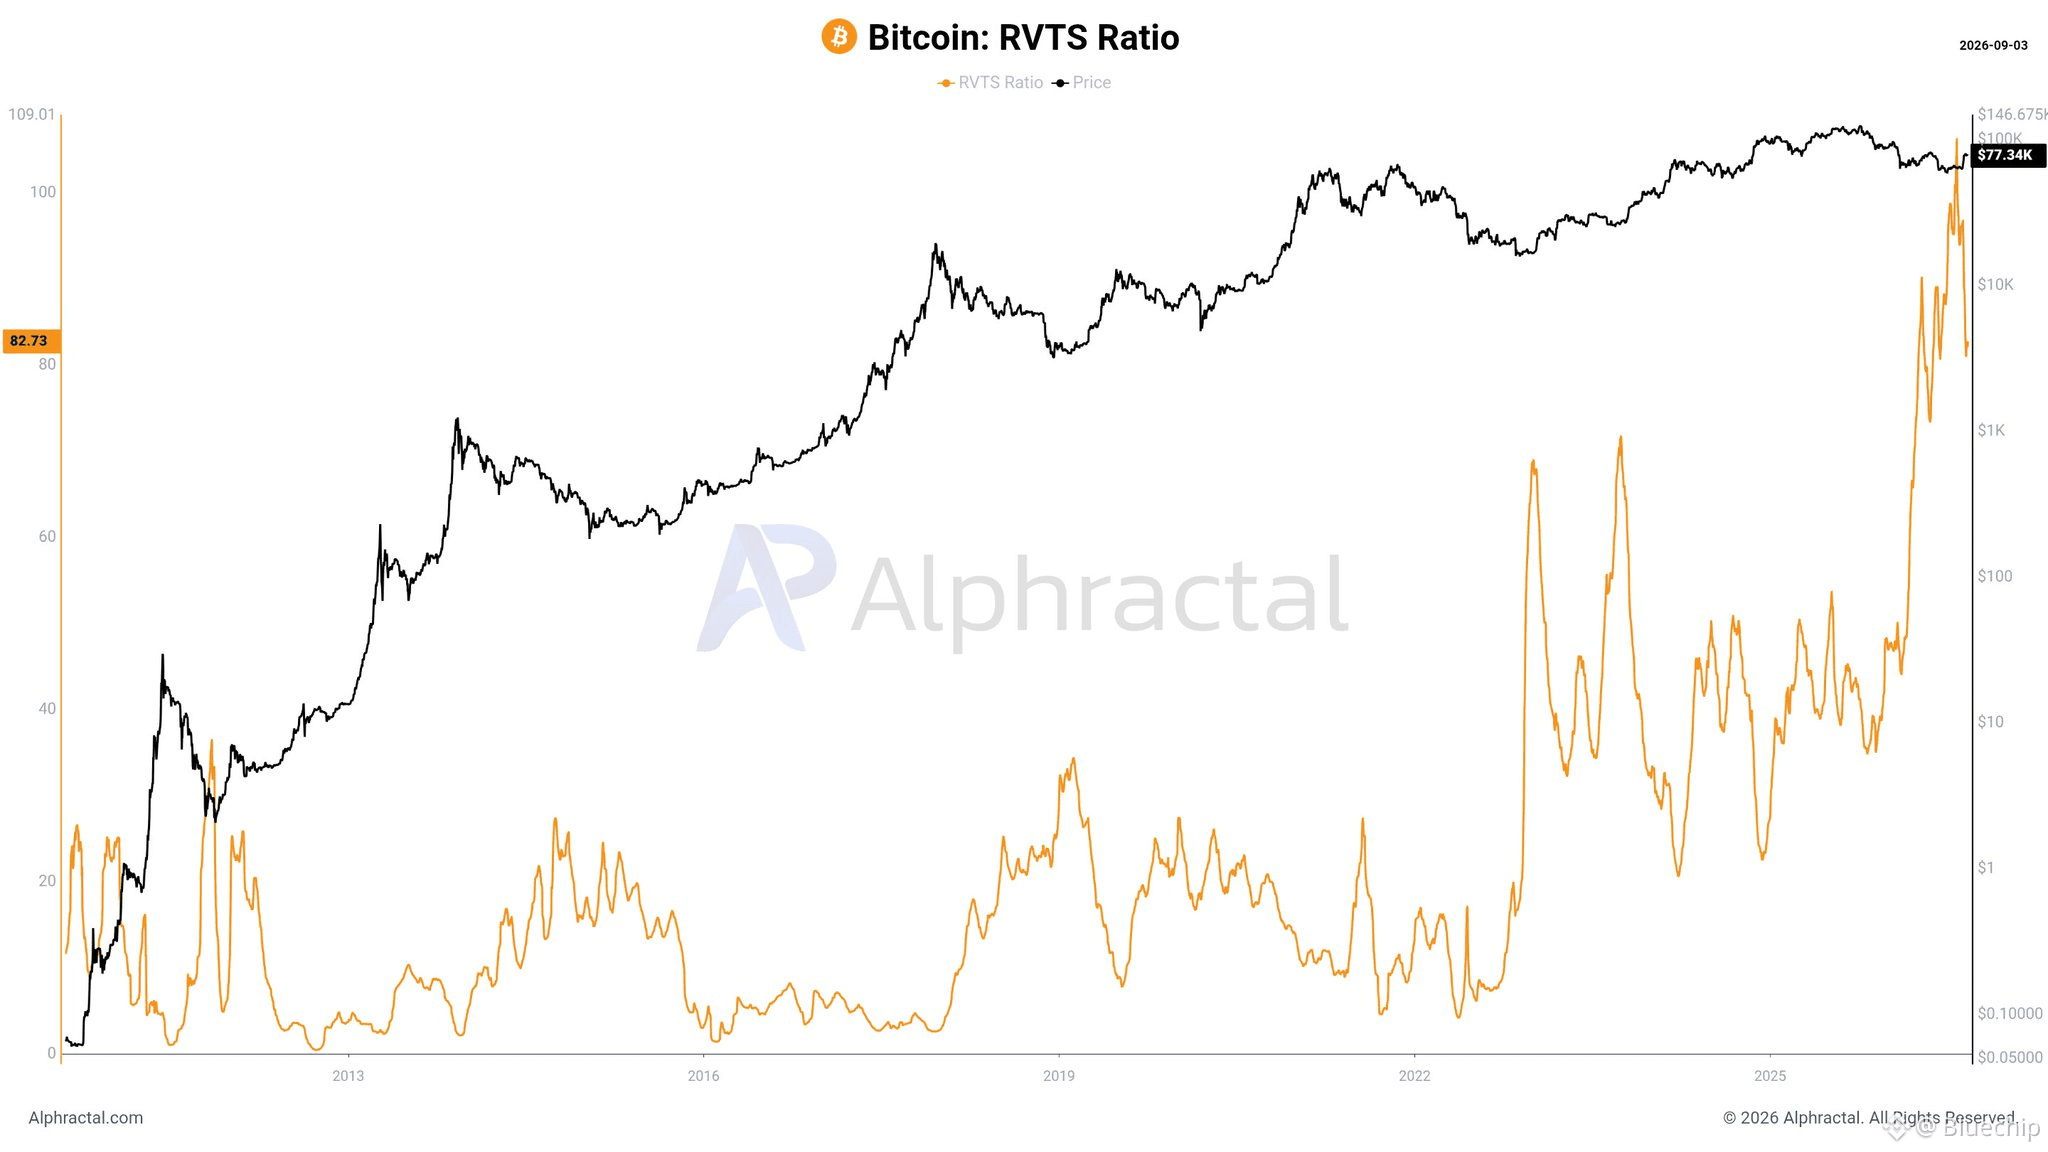
Bitcoin: 82.73
$BTC is now trading at one of the highest RVTS regimes in its history. Valuation has expanded much faster than adjusted on chain transaction activity. Historically, these elevated zones deserve attention because price is demanding increasingly stronger network activity to justify the valuation.
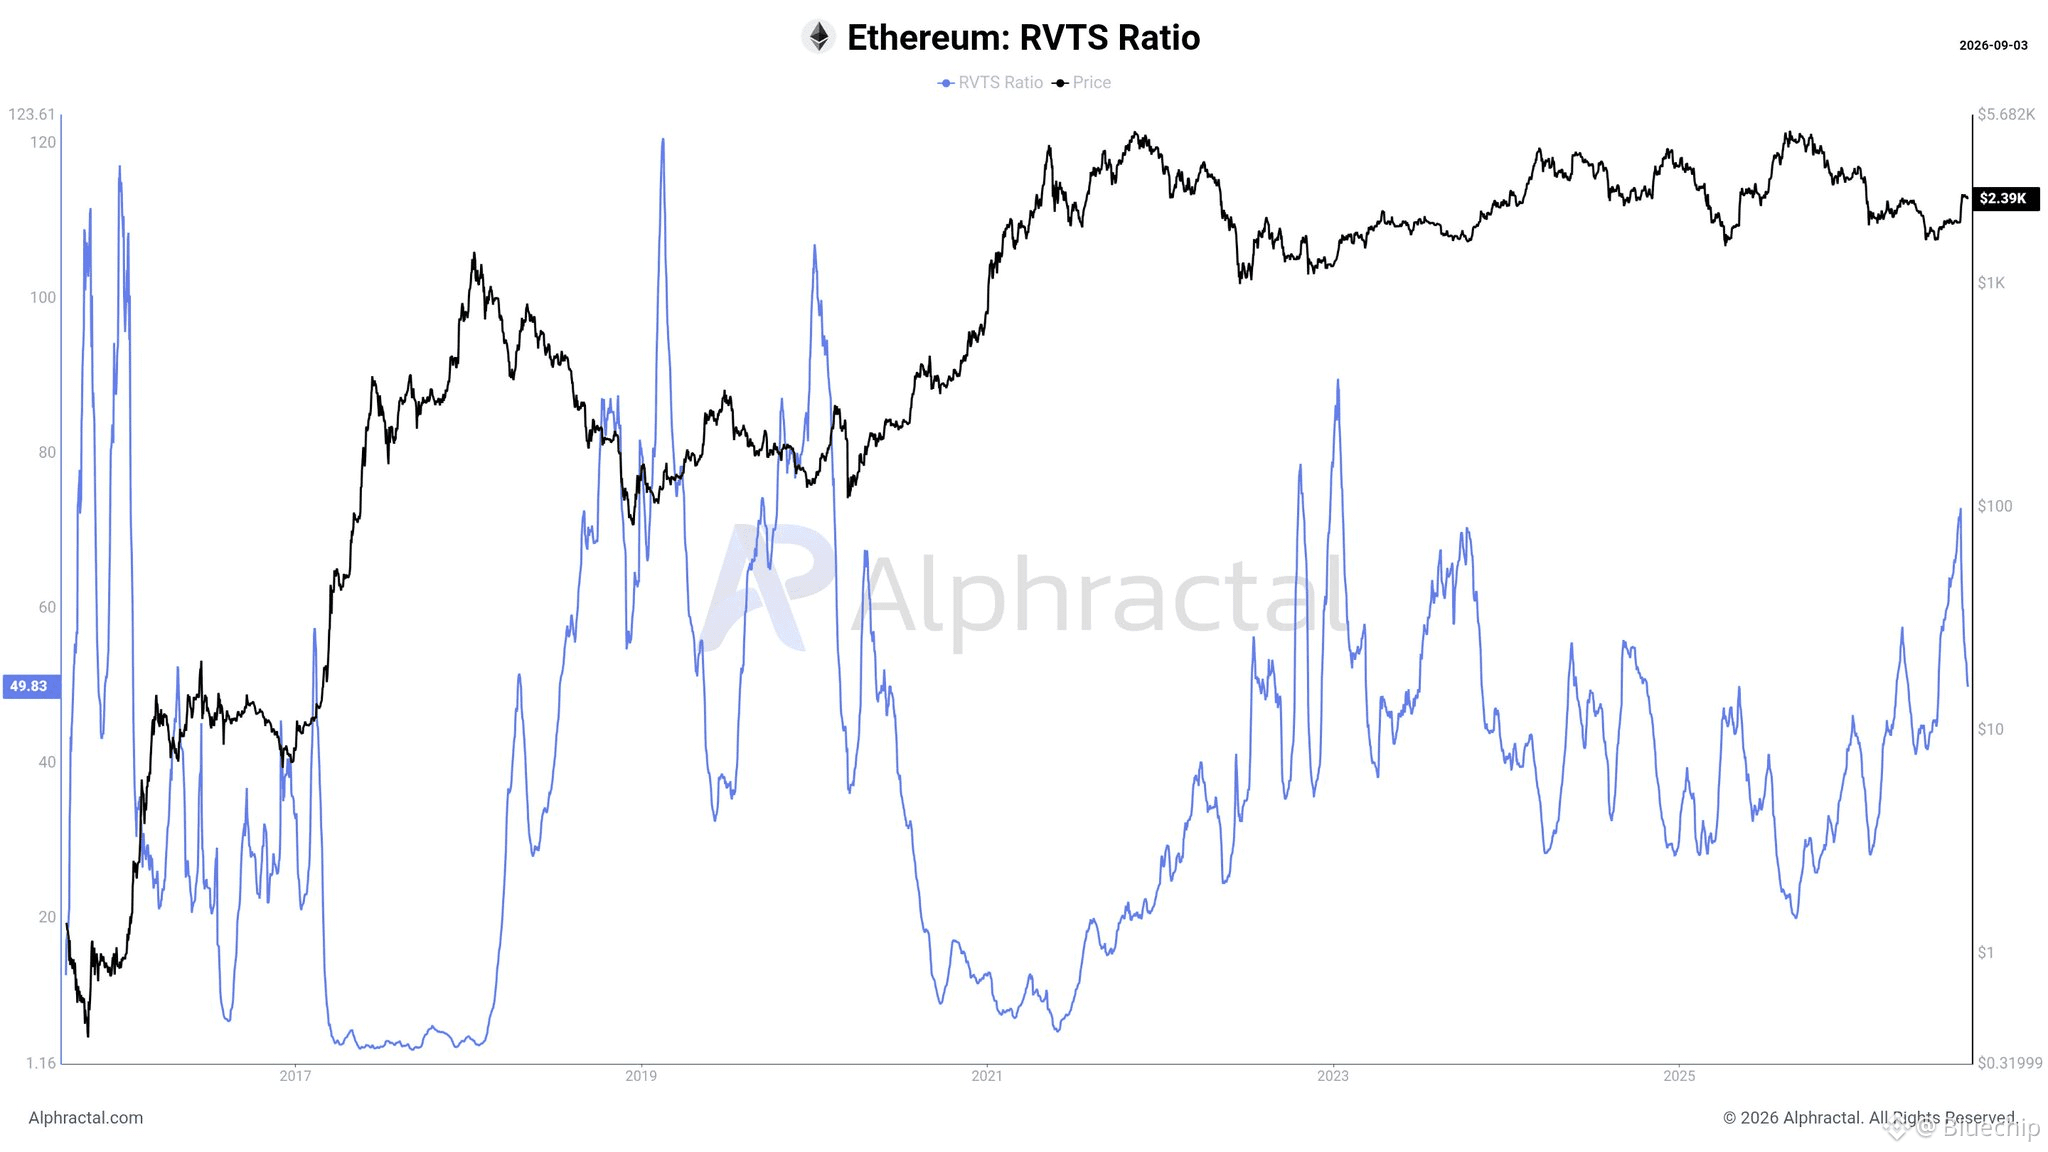
Ethereum: 49.83
$ETH sits in a much more neutral zone. RVTS recently surged above 70 before cooling back toward 50. Network valuation remains elevated relative to activity, but nowhere near the extreme divergence currently visible in Bitcoin.
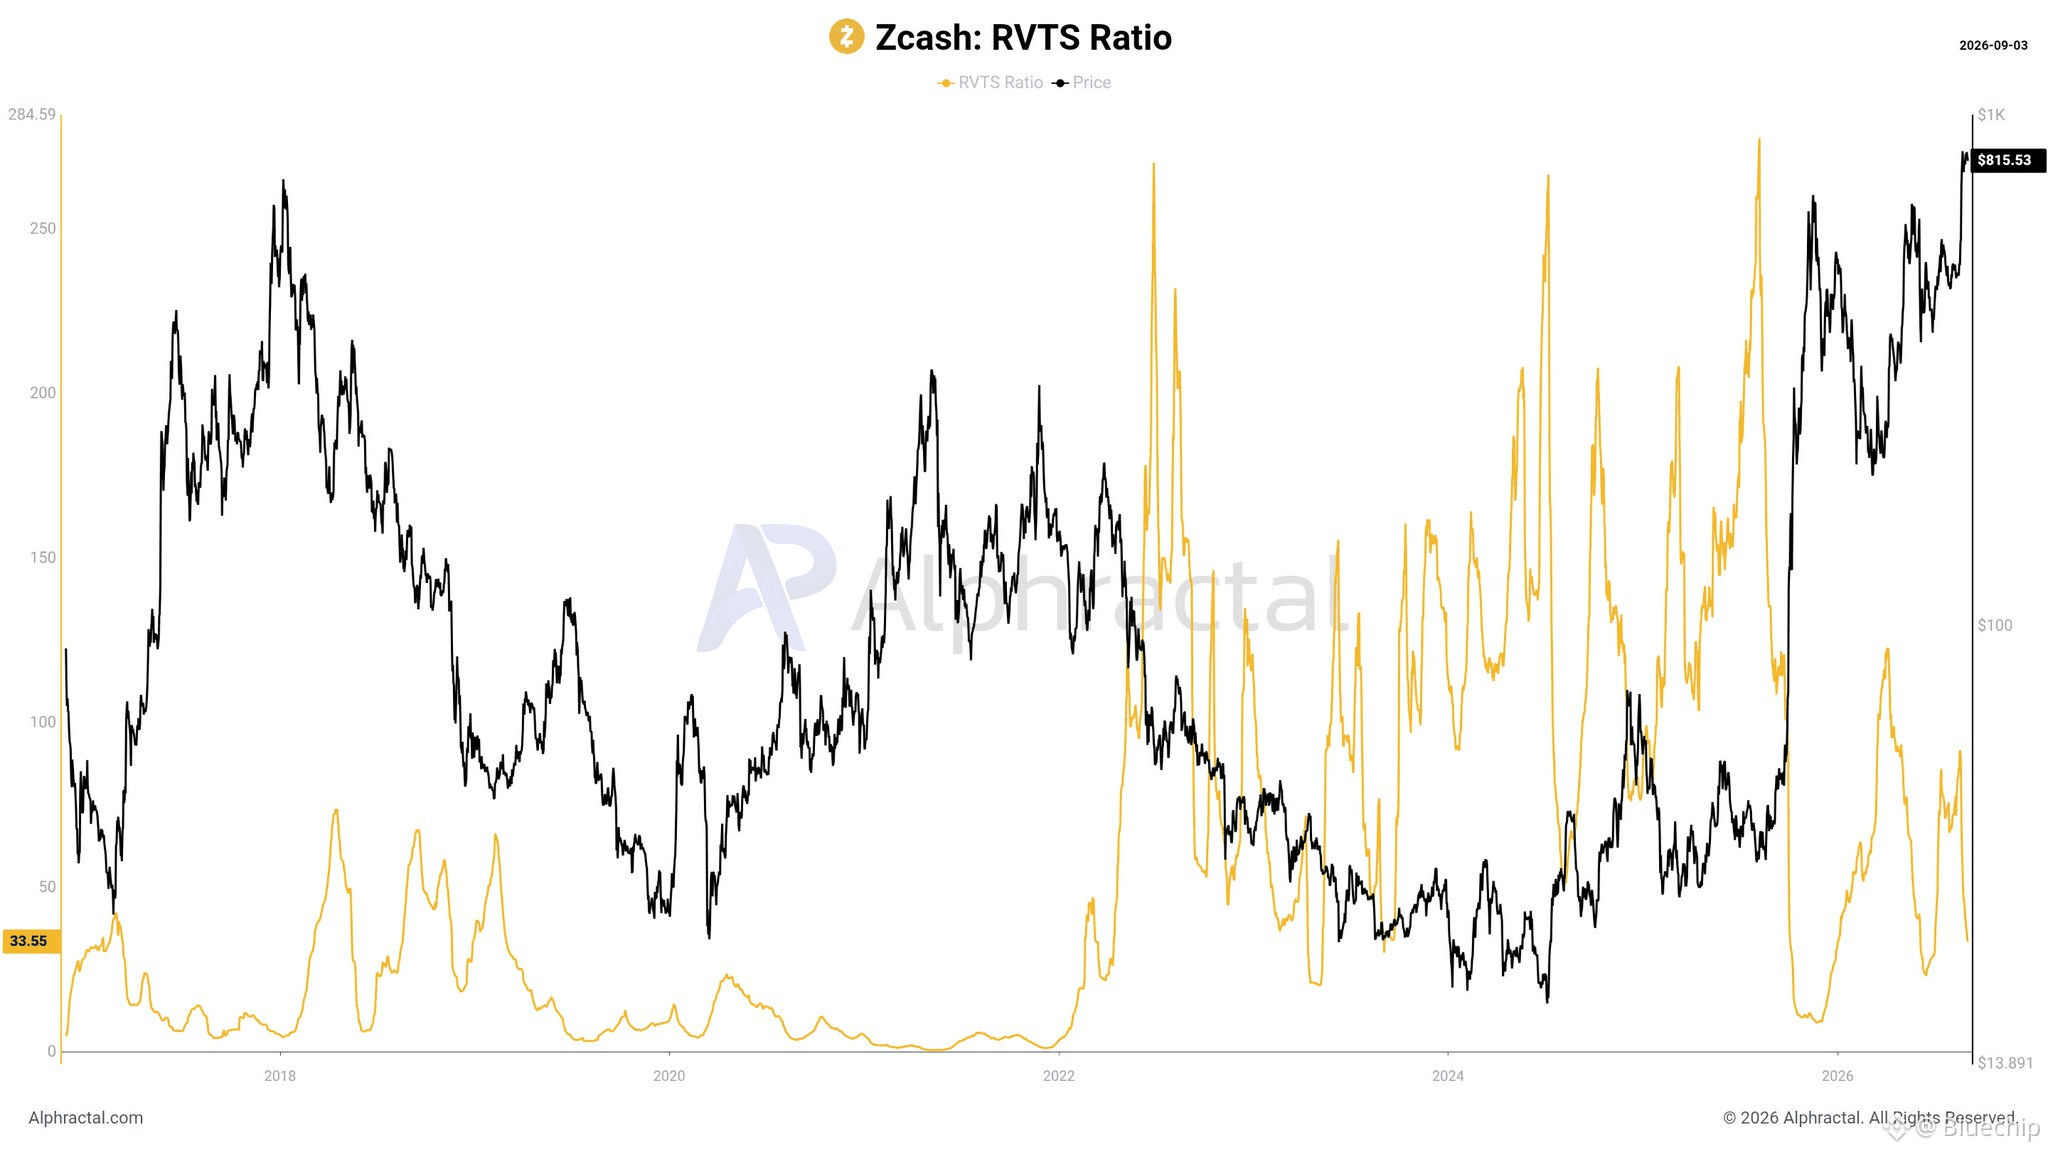
Zcash: 33.55
$ZEC is particularly interesting. Despite the massive price appreciation, RVTS remains far below many of the extreme readings seen between 2022 and 2025. Economic activity has kept up much better with valuation than the price chart alone might suggest.
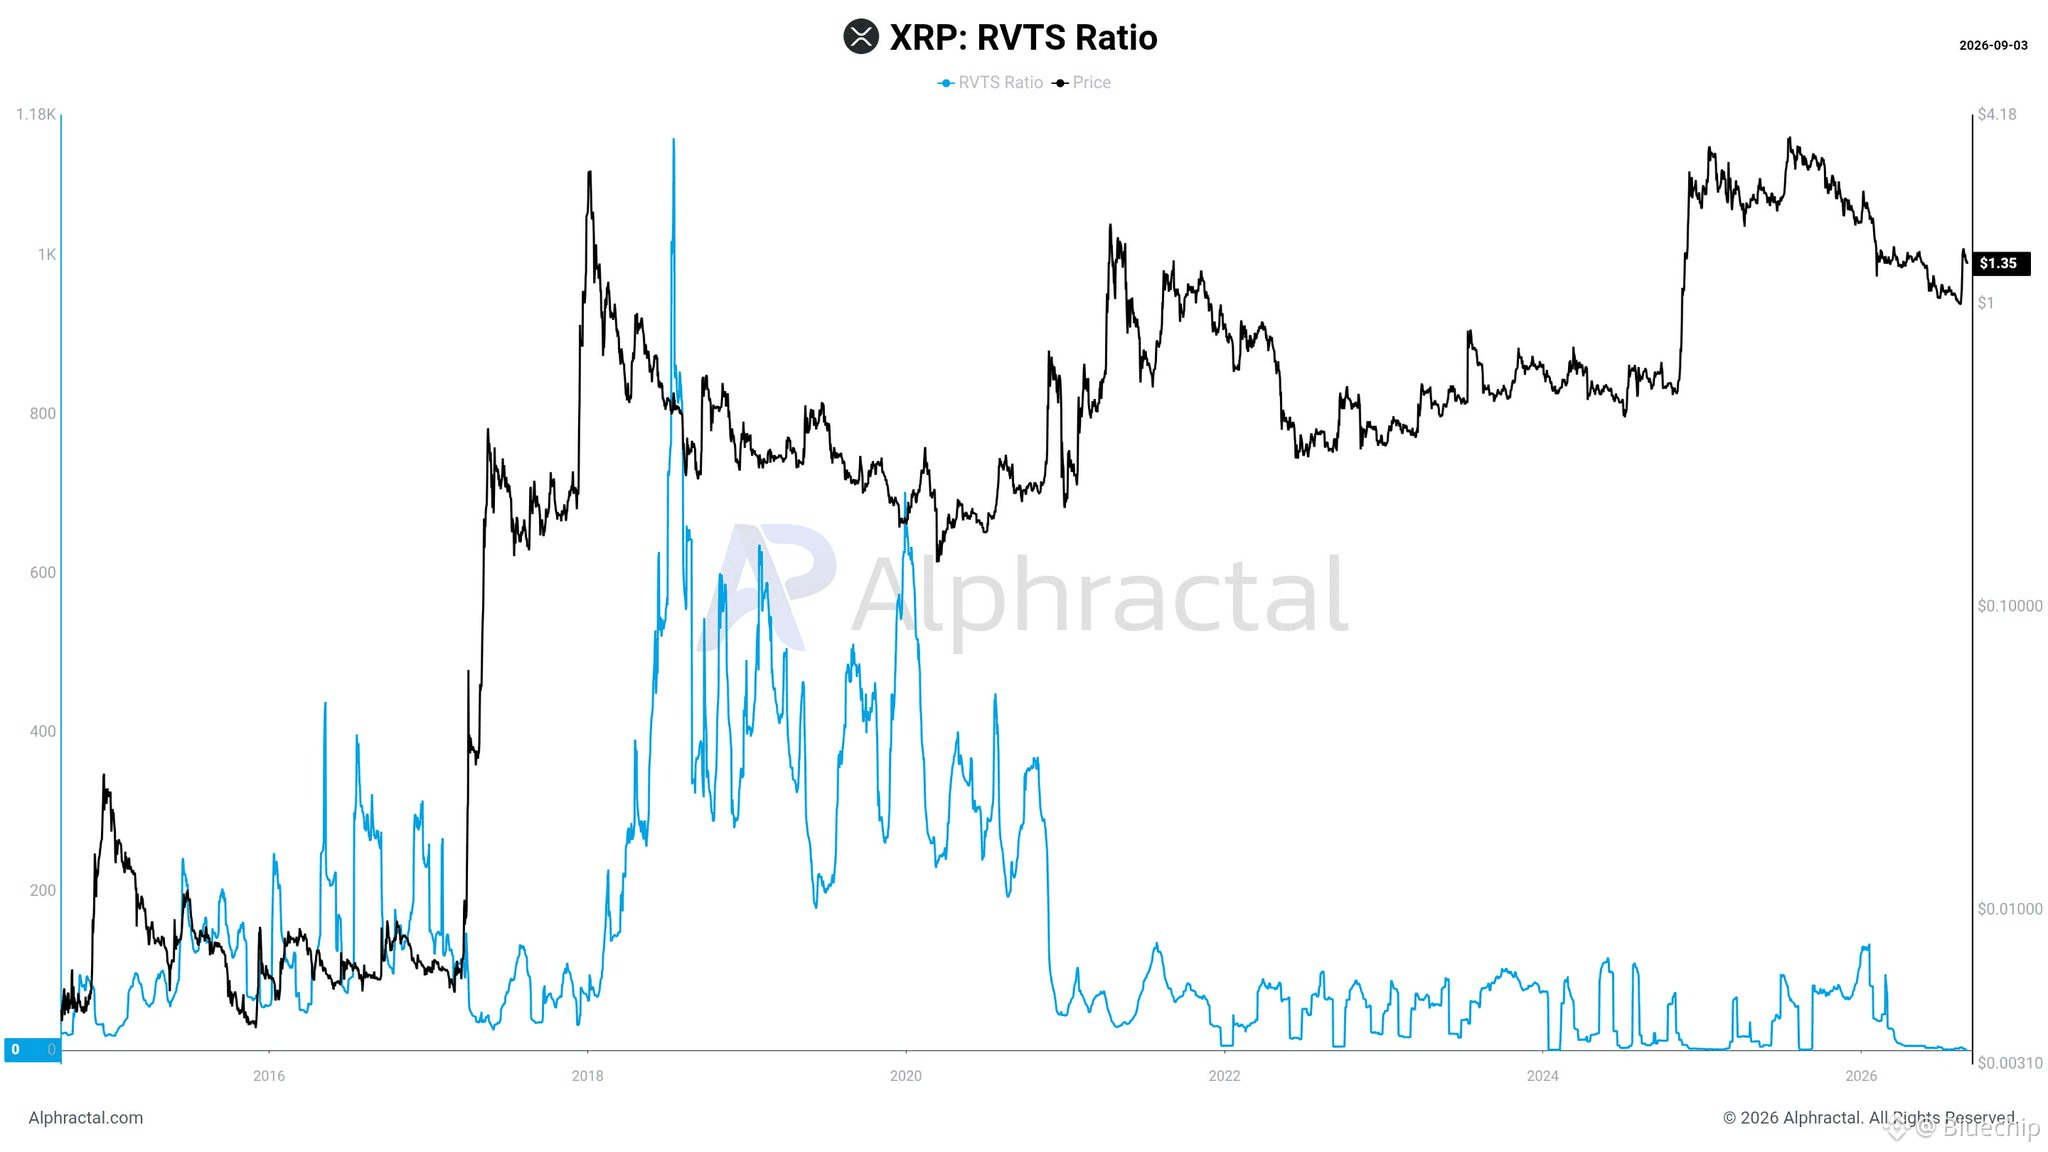
XRP: near historical lows
$XRP shows almost the opposite structure of Bitcoin. RVTS has collapsed toward its historical floor, meaning adjusted transaction activity is extremely large relative to network valuation compared with its own historical pattern.
The important point is that RVTS values should not be compared mechanically between different blockchains. Each network has a different transaction structure, user behavior and economic model.
What matters most is where each asset sits relative to its own historical RVTS regime.
Right now the contrast is striking:
Bitcoin: historically expensive relative to activity
Ethereum: intermediate
Zcash: relatively balanced despite the rally
XRP: historically activity heavy relative to valuation
Price tells one story.
Network activity can tell a completely different one.
RVTS uses a 28 day moving average of adjusted transaction volume, helping us compare network valuation against actual economic activity while filtering short term noise.
Bitcoin: 82.73
$BTC is now trading at one of the highest RVTS regimes in its history. Valuation has expanded much faster than adjusted on chain transaction activity. Historically, these elevated zones deserve attention because price is demanding increasingly stronger network activity to justify the valuation.
Ethereum: 49.83
$ETH sits in a much more neutral zone. RVTS recently surged above 70 before cooling back toward 50. Network valuation remains elevated relative to activity, but nowhere near the extreme divergence currently visible in Bitcoin.
Zcash: 33.55
$ZEC is particularly interesting. Despite the massive price appreciation, RVTS remains far below many of the extreme readings seen between 2022 and 2025. Economic activity has kept up much better with valuation than the price chart alone might suggest.
XRP: near historical lows
$XRP shows almost the opposite structure of Bitcoin. RVTS has collapsed toward its historical floor, meaning adjusted transaction activity is extremely large relative to network valuation compared with its own historical pattern.
The important point is that RVTS values should not be compared mechanically between different blockchains. Each network has a different transaction structure, user behavior and economic model.
What matters most is where each asset sits relative to its own historical RVTS regime.
Right now the contrast is striking:
Bitcoin: historically expensive relative to activity
Ethereum: intermediate
Zcash: relatively balanced despite the rally
XRP: historically activity heavy relative to valuation
Price tells one story.
Network activity can tell a completely different one.