Is September Really Weak for Bitcoin? What Do Historical Data Say?
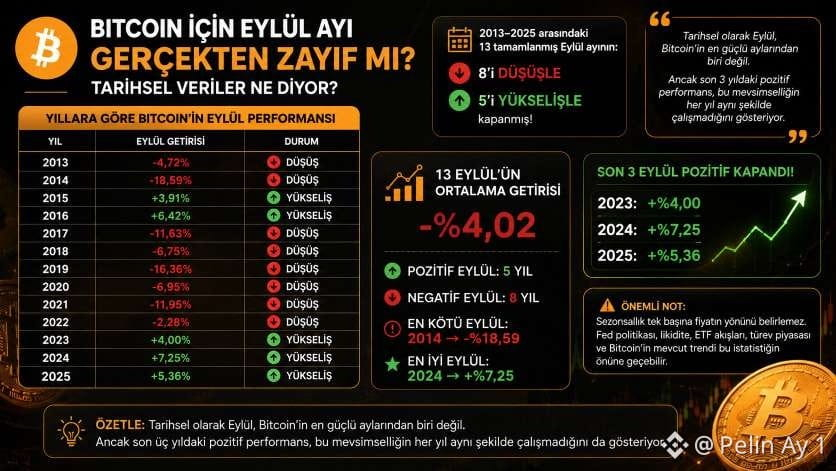
When we look at Bitcoin's past September performance, a striking picture emerges. Of the 13 completed Septembers between 2013 and 2025:
🔴 8 closed lower
🟢 5 closed higher.
So #Bitcoin has historically seen mostly declines in September.
📊 Bitcoin's September performance by year:
• 2013: 🔴 -4.72%
• 2014: 🔴 -18.59%
• 2015: 🟢 +3.91%
• 2016: 🟢 +6.42%
• 2017: 🔴 -11.63%
• 2018: 🔴 -6.75%
• 2019: 🔴 -16.36%
• 2020: 🔴 -6.95%
• 2021: 🔴 -11.95%
• 2022: 🔴 -2.28%
• 2023: 🟢 +4.00%
• 2024: 🟢 +7.25%
• 2025: 🟢 +5.36%
📌 Average return for 13 Septembers: -4.02%
📌 Positive Septembers: 5 years
📌 Negative Septembers: 8 years
📌 Worst September: 2014 → -18.59%
📌 Best September: 2024 → +7.25%
Bitcoin's September performance was especially weak during the 2017–2022 period. In contrast, the picture changed over the last three completed Septembers:
🟢 2023: +4.00%
🟢 2024: +7.25%
🟢 2025: +5.36%
So it is not correct to say "Bitcoin always falls in September." However, long-term statistics show that September is a period in which Bitcoin tends to have a lower positive expectancy and can experience higher volatility.
⚠️ Important: Seasonality alone does not determine the direction of price. Fed policy, liquidity, ETF flows, the derivatives market, and Bitcoin's current trend can override this statistic.
In summary: Historically, September is not one of Bitcoin's strongest months. However, the positive performance in the last three years also shows that this seasonality does not work the same way every year.
Note: I did not include September 2026 in the comparison because it has not been completed yet. Also, due to differences in daily close/time across different data providers, small percentage differences may be seen; the series above is based on 2013–2025 September data prepared with the same methodology. $BTC
When we look at Bitcoin's past September performance, a striking picture emerges. Of the 13 completed Septembers between 2013 and 2025:
🔴 8 closed lower
🟢 5 closed higher.
So #Bitcoin has historically seen mostly declines in September.
📊 Bitcoin's September performance by year:
• 2013: 🔴 -4.72%
• 2014: 🔴 -18.59%
• 2015: 🟢 +3.91%
• 2016: 🟢 +6.42%
• 2017: 🔴 -11.63%
• 2018: 🔴 -6.75%
• 2019: 🔴 -16.36%
• 2020: 🔴 -6.95%
• 2021: 🔴 -11.95%
• 2022: 🔴 -2.28%
• 2023: 🟢 +4.00%
• 2024: 🟢 +7.25%
• 2025: 🟢 +5.36%
📌 Average return for 13 Septembers: -4.02%
📌 Positive Septembers: 5 years
📌 Negative Septembers: 8 years
📌 Worst September: 2014 → -18.59%
📌 Best September: 2024 → +7.25%
Bitcoin's September performance was especially weak during the 2017–2022 period. In contrast, the picture changed over the last three completed Septembers:
🟢 2023: +4.00%
🟢 2024: +7.25%
🟢 2025: +5.36%
So it is not correct to say "Bitcoin always falls in September." However, long-term statistics show that September is a period in which Bitcoin tends to have a lower positive expectancy and can experience higher volatility.
⚠️ Important: Seasonality alone does not determine the direction of price. Fed policy, liquidity, ETF flows, the derivatives market, and Bitcoin's current trend can override this statistic.
In summary: Historically, September is not one of Bitcoin's strongest months. However, the positive performance in the last three years also shows that this seasonality does not work the same way every year.
Note: I did not include September 2026 in the comparison because it has not been completed yet. Also, due to differences in daily close/time across different data providers, small percentage differences may be seen; the series above is based on 2013–2025 September data prepared with the same methodology. $BTC