
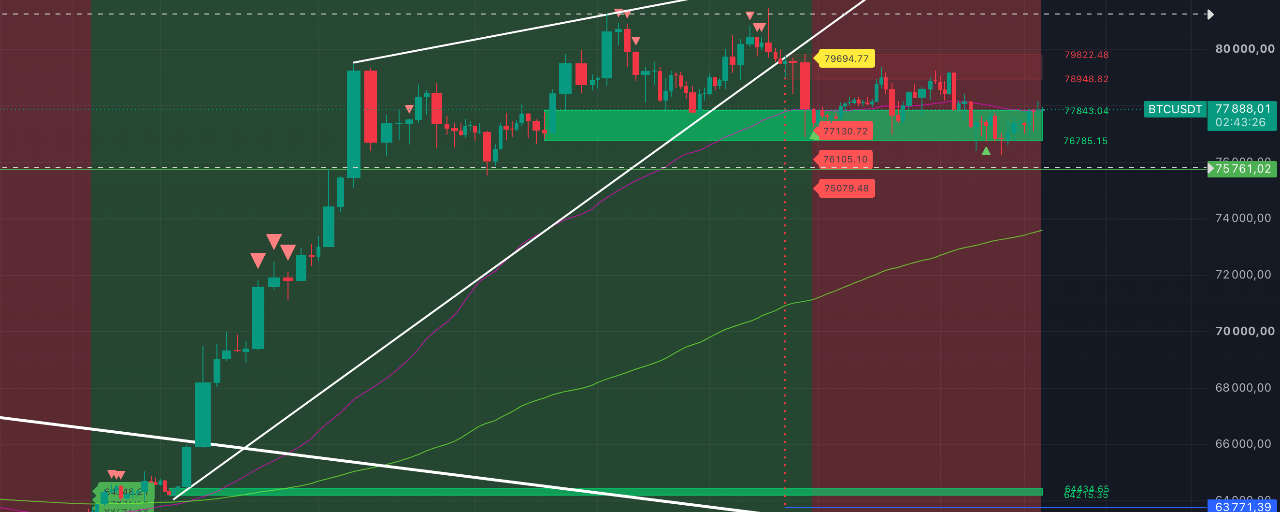


BTC today is trying to show a recovery above $78,000, processing the Monitor’s night signal.
All today’s rebound is about working off the potential loyalty marks on the 4- and 5-hour time frames, which were discussed yesterday.
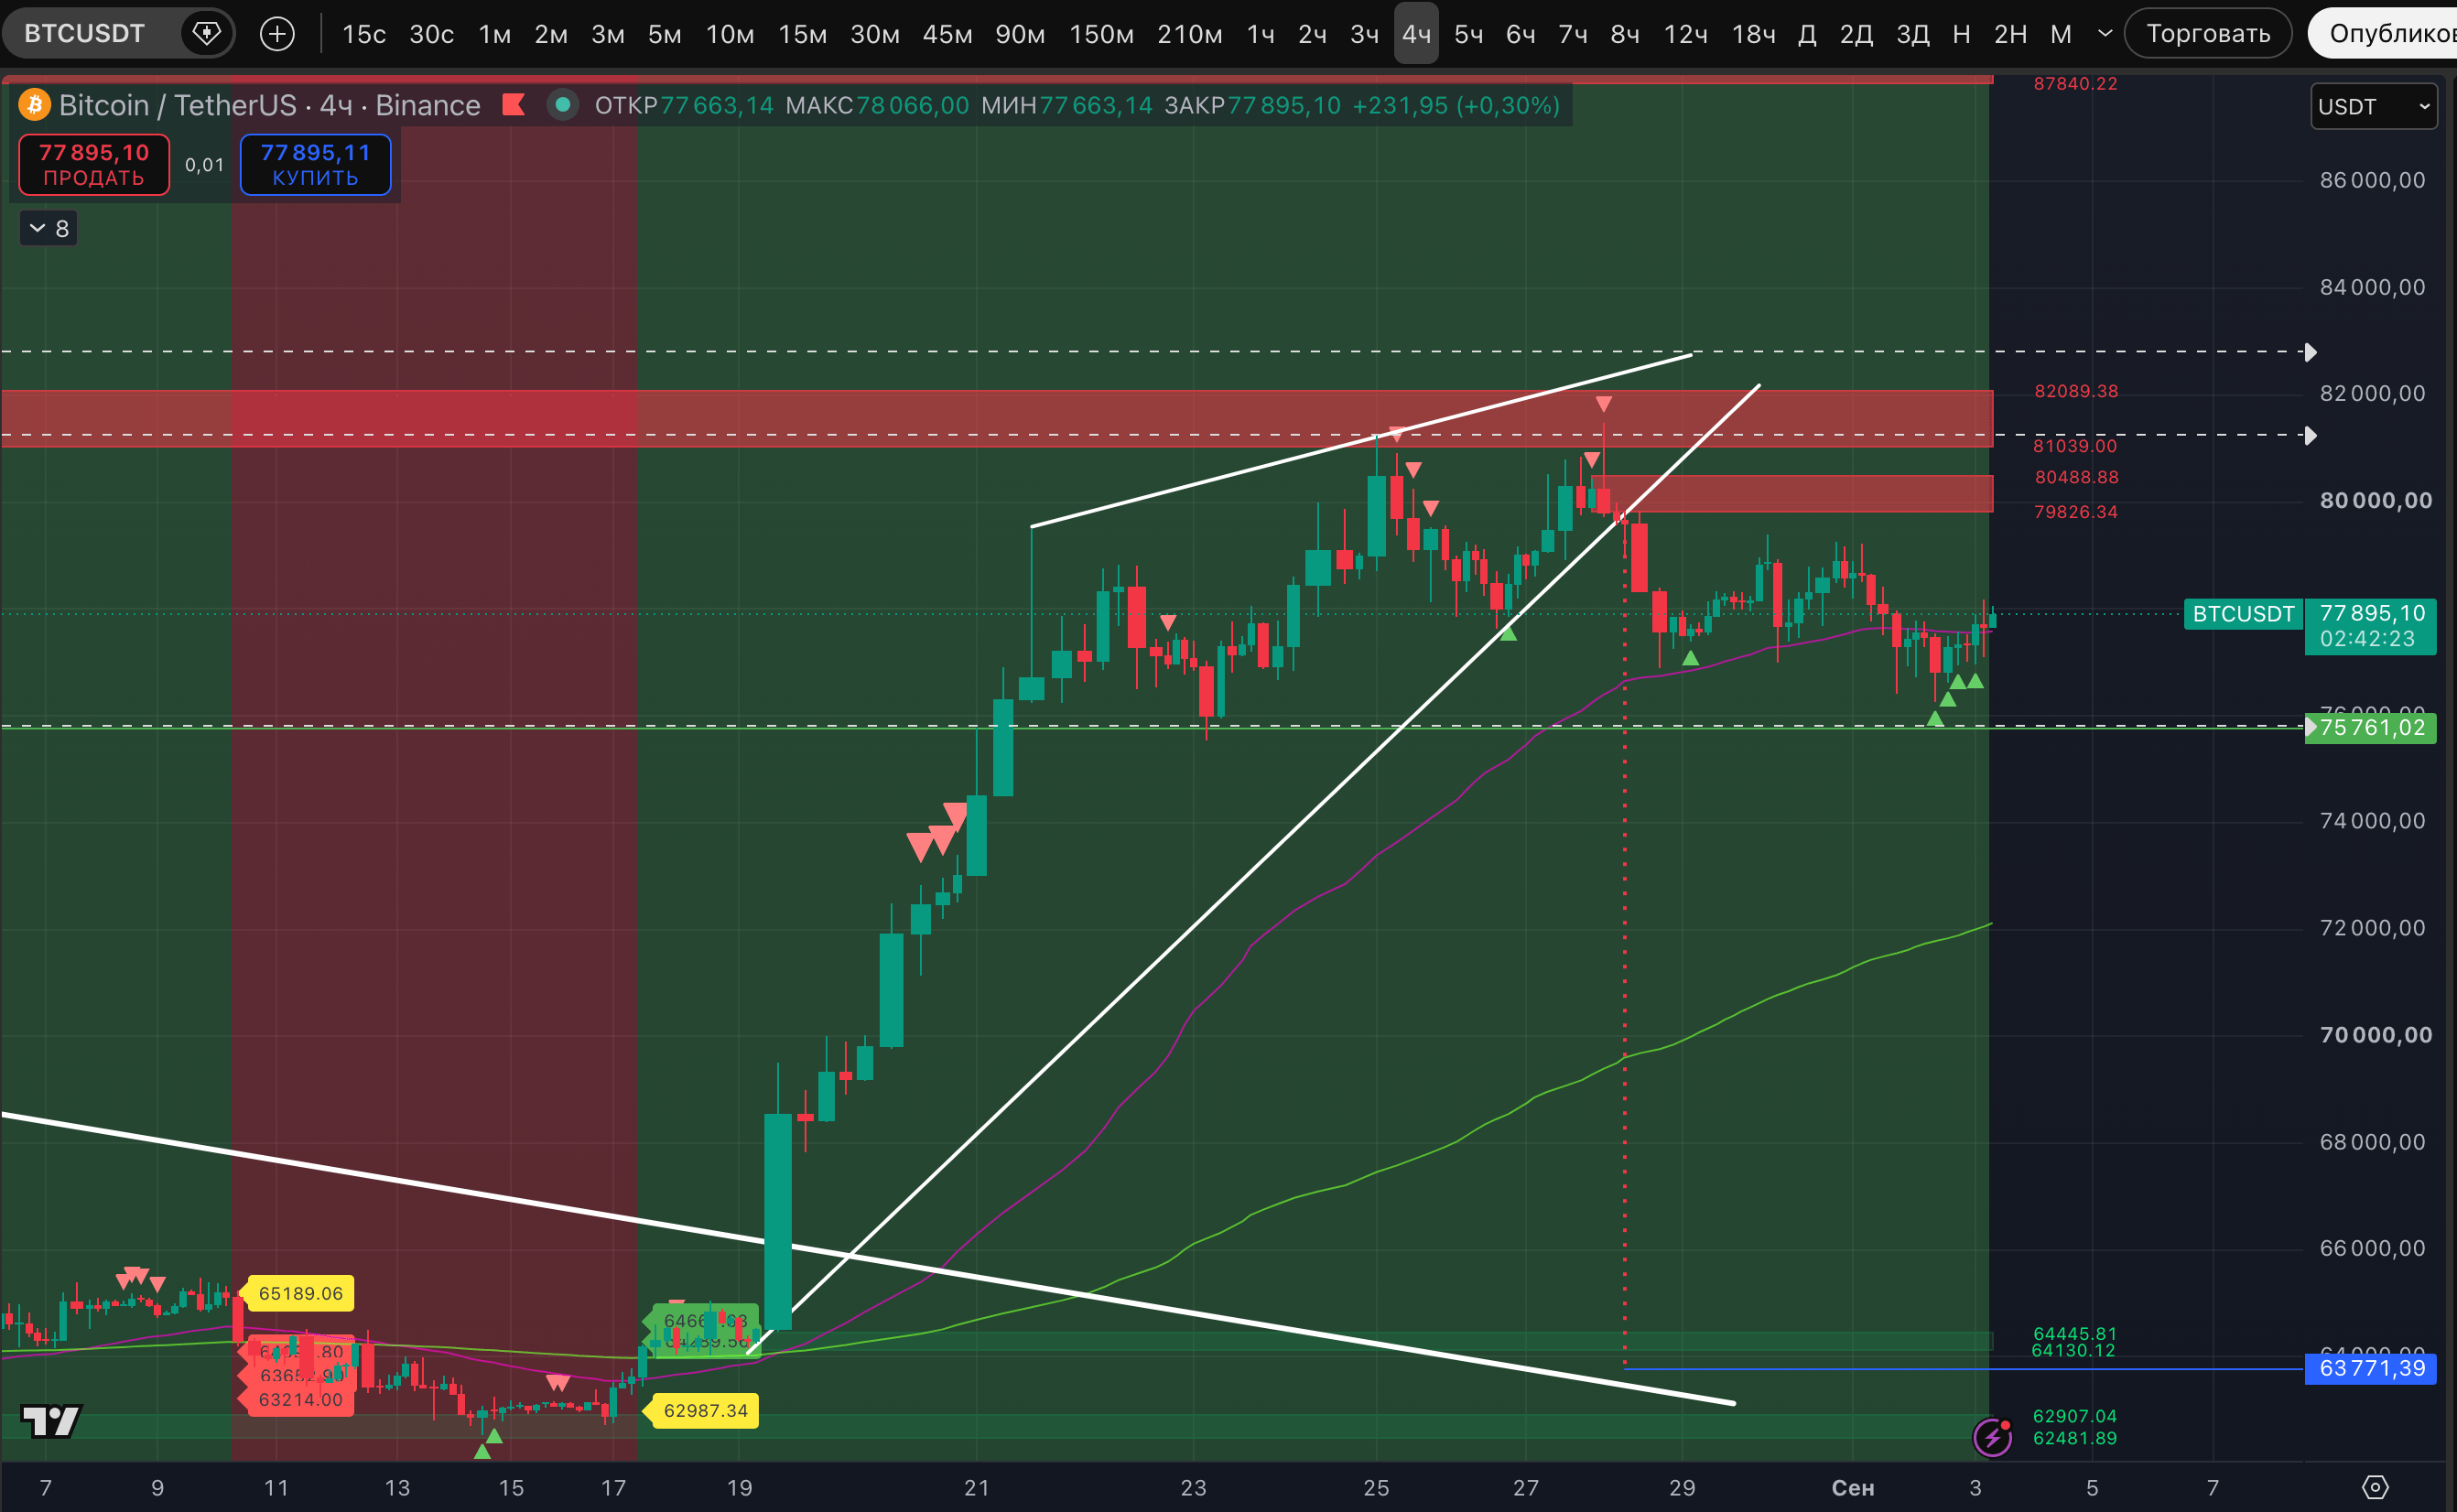
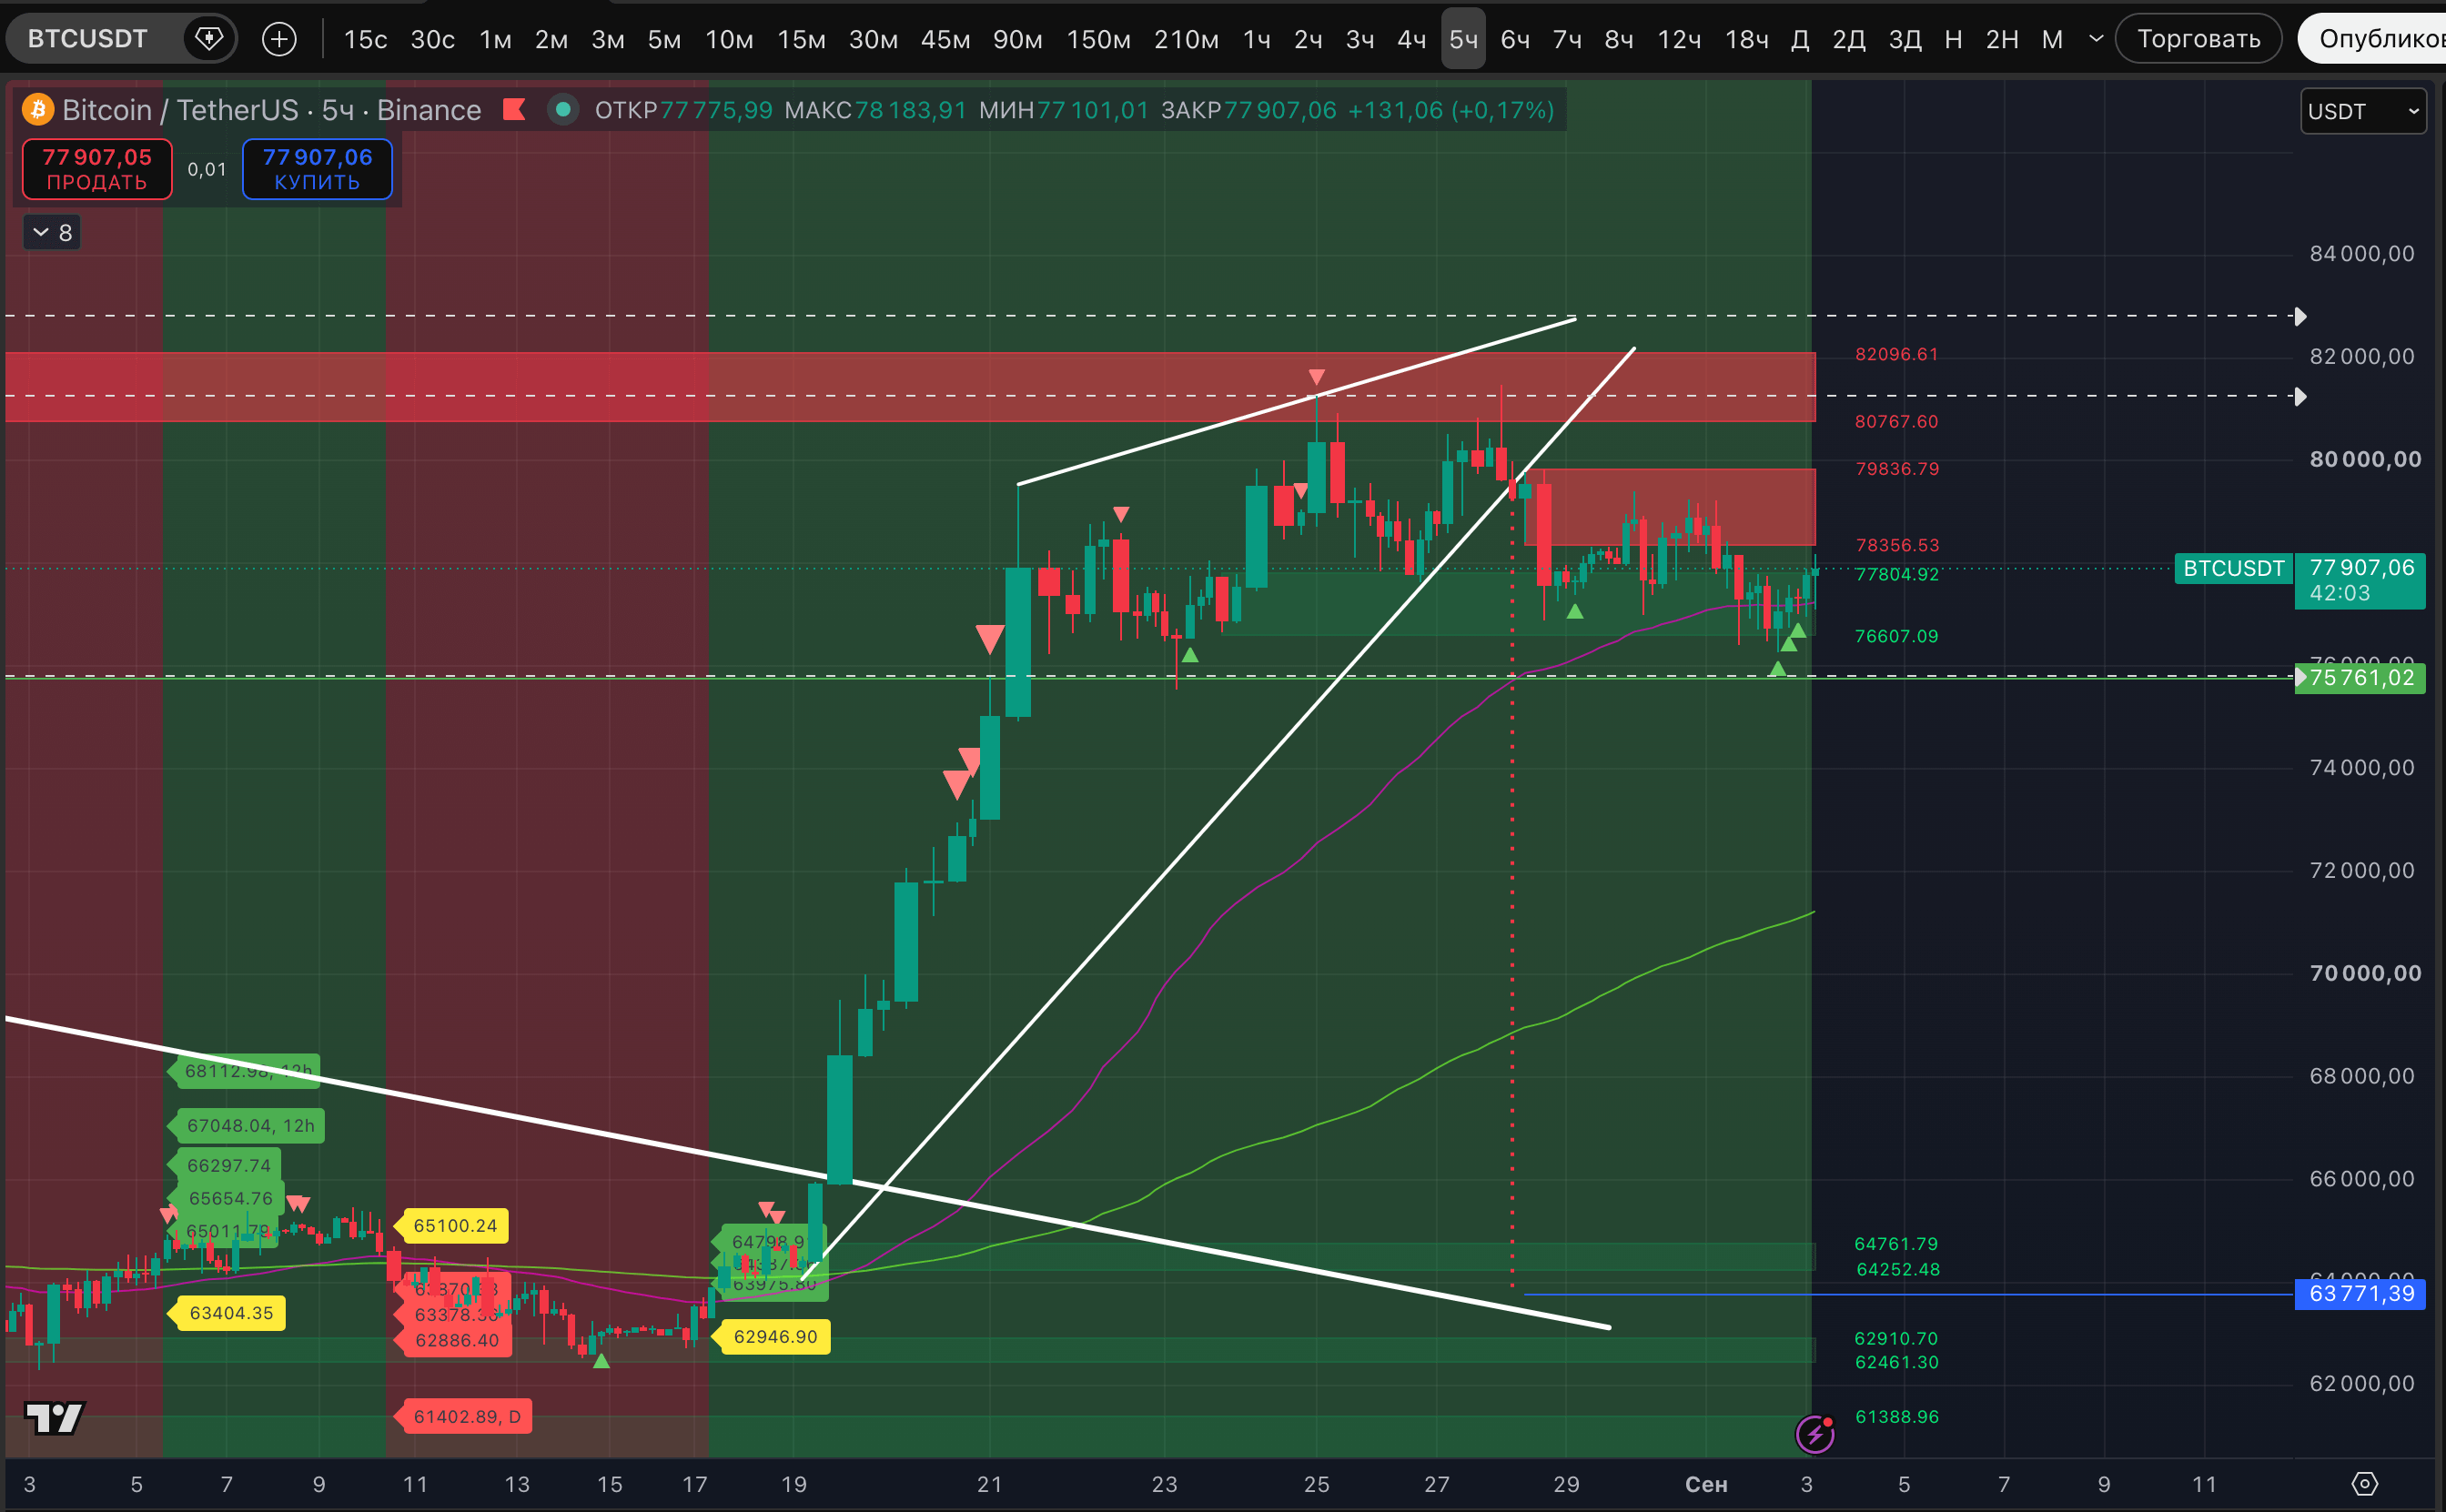
At night, the algorithm identified a potential loyalty mark for #BTC on the daily time frame. And therefore it issued a forecast:
"WARNING — high probability of a noticeable bounce and a short-/medium-term rise in the crypto market, starting in the coming days. During this time, the low could still be updated."
Considering the market context—medium-term growth and, specifically, a significant bounce—there are doubts. This low marker does not override the Strong signal for the daily timeframe high that was obtained on August 23–25. Plus, the marker for a potential high on the 2-day timeframe. The numerous correction signals for altcoins that were written about yesterday—this marker also does not cancel. A large number of high-side signals on #ETH, including the weekly timeframe, as well as persistent downtrends across several altcoins on the 12-hour timeframe, among them #XRP.
A fresh BTC signal on the daily chart rather suggests the odds of a bounce. And we’ll note that today’s rise has already invalidated this “loy” marker on the daily. The marker is gone for now. On the one hand, according to our indicator, this means the candlestick structure has switched to bullish. On the other hand, if the daily candle closes without a marker, it will remove the question about the extremum signal, for which a new impulse up move could have been expected.
Locally, the picture is the same—on the 3-hour trigger timeframe for us, the battle is over the $76,785–$77,843 zone.
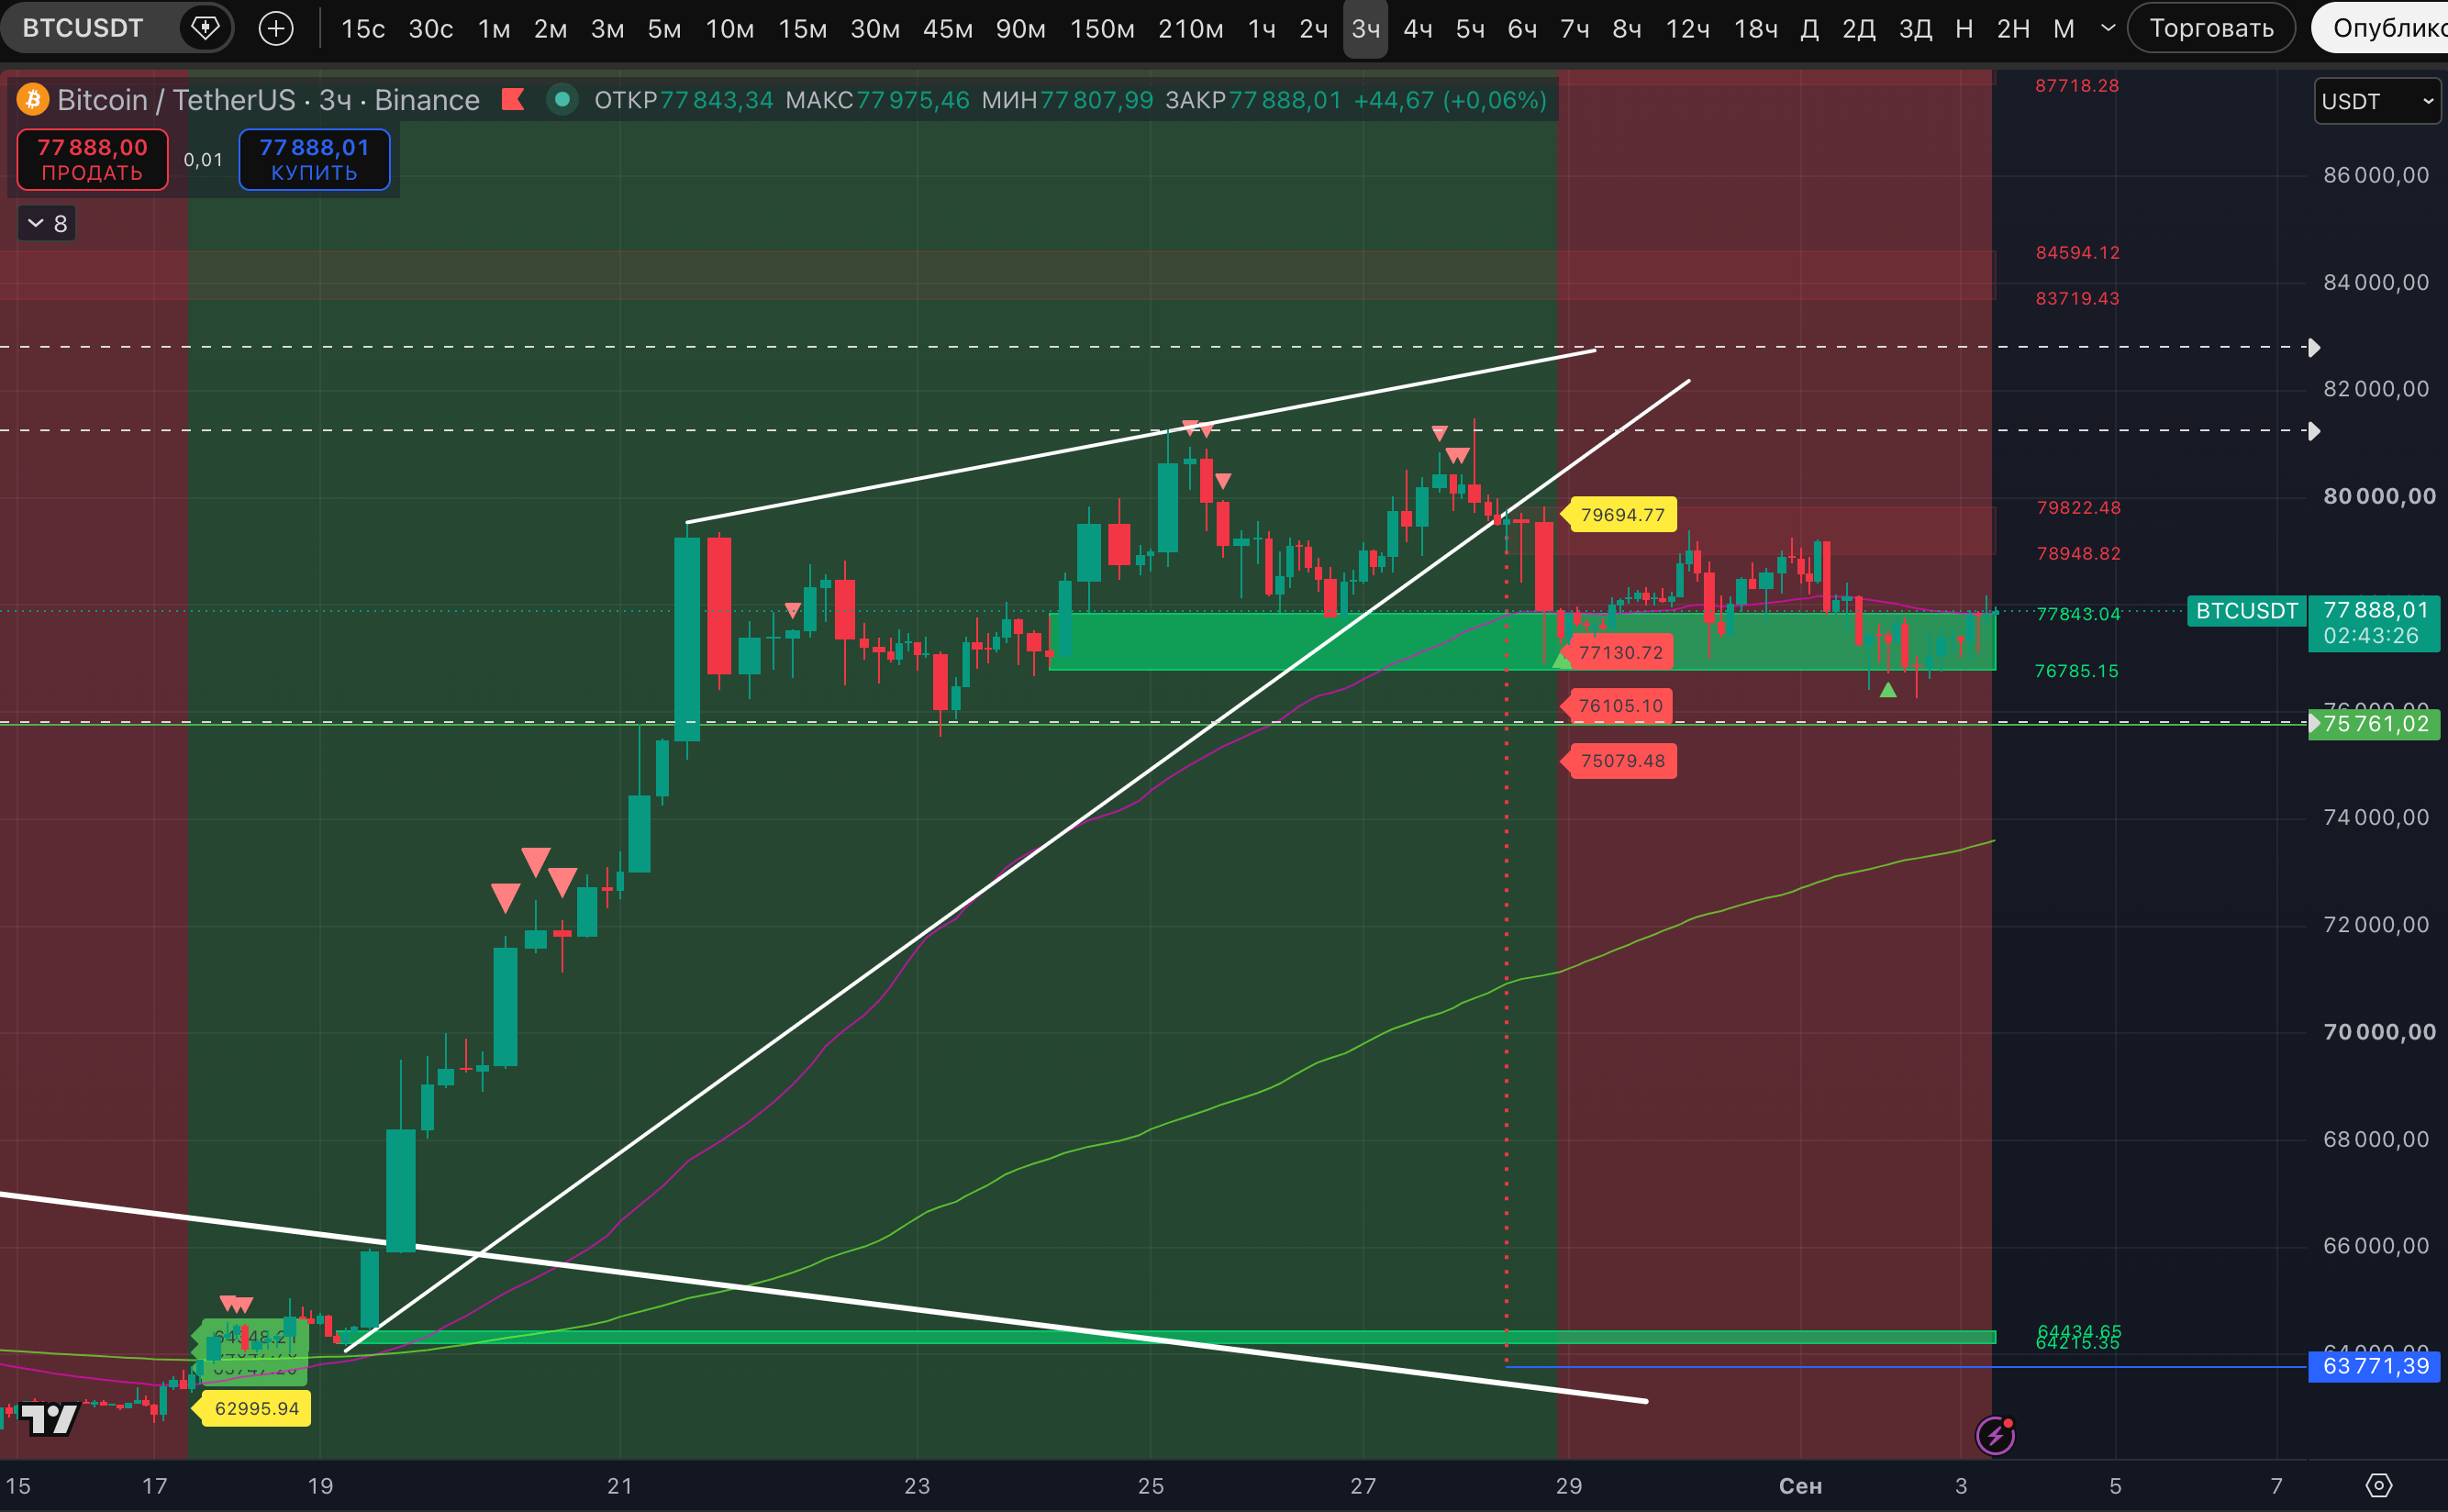
If buyers manage to push off from it, resistance on this timeframe will be $78,948–$79,822. Which has also been mentioned more than once this week. Until the price shows a close of the body of the 3-hour candle above $79,822, our scenario of consolidation and distribution before moving down remains in force. And we’ll be waiting for the $76,785–$77,843 zone to finally be absorbed, opening the way to further decline.
Separately note that on the 2- and 3-day timeframe, the price on this pump hit the 200 EMA. Right now these are the levels $78,172 and $79,162, respectively.
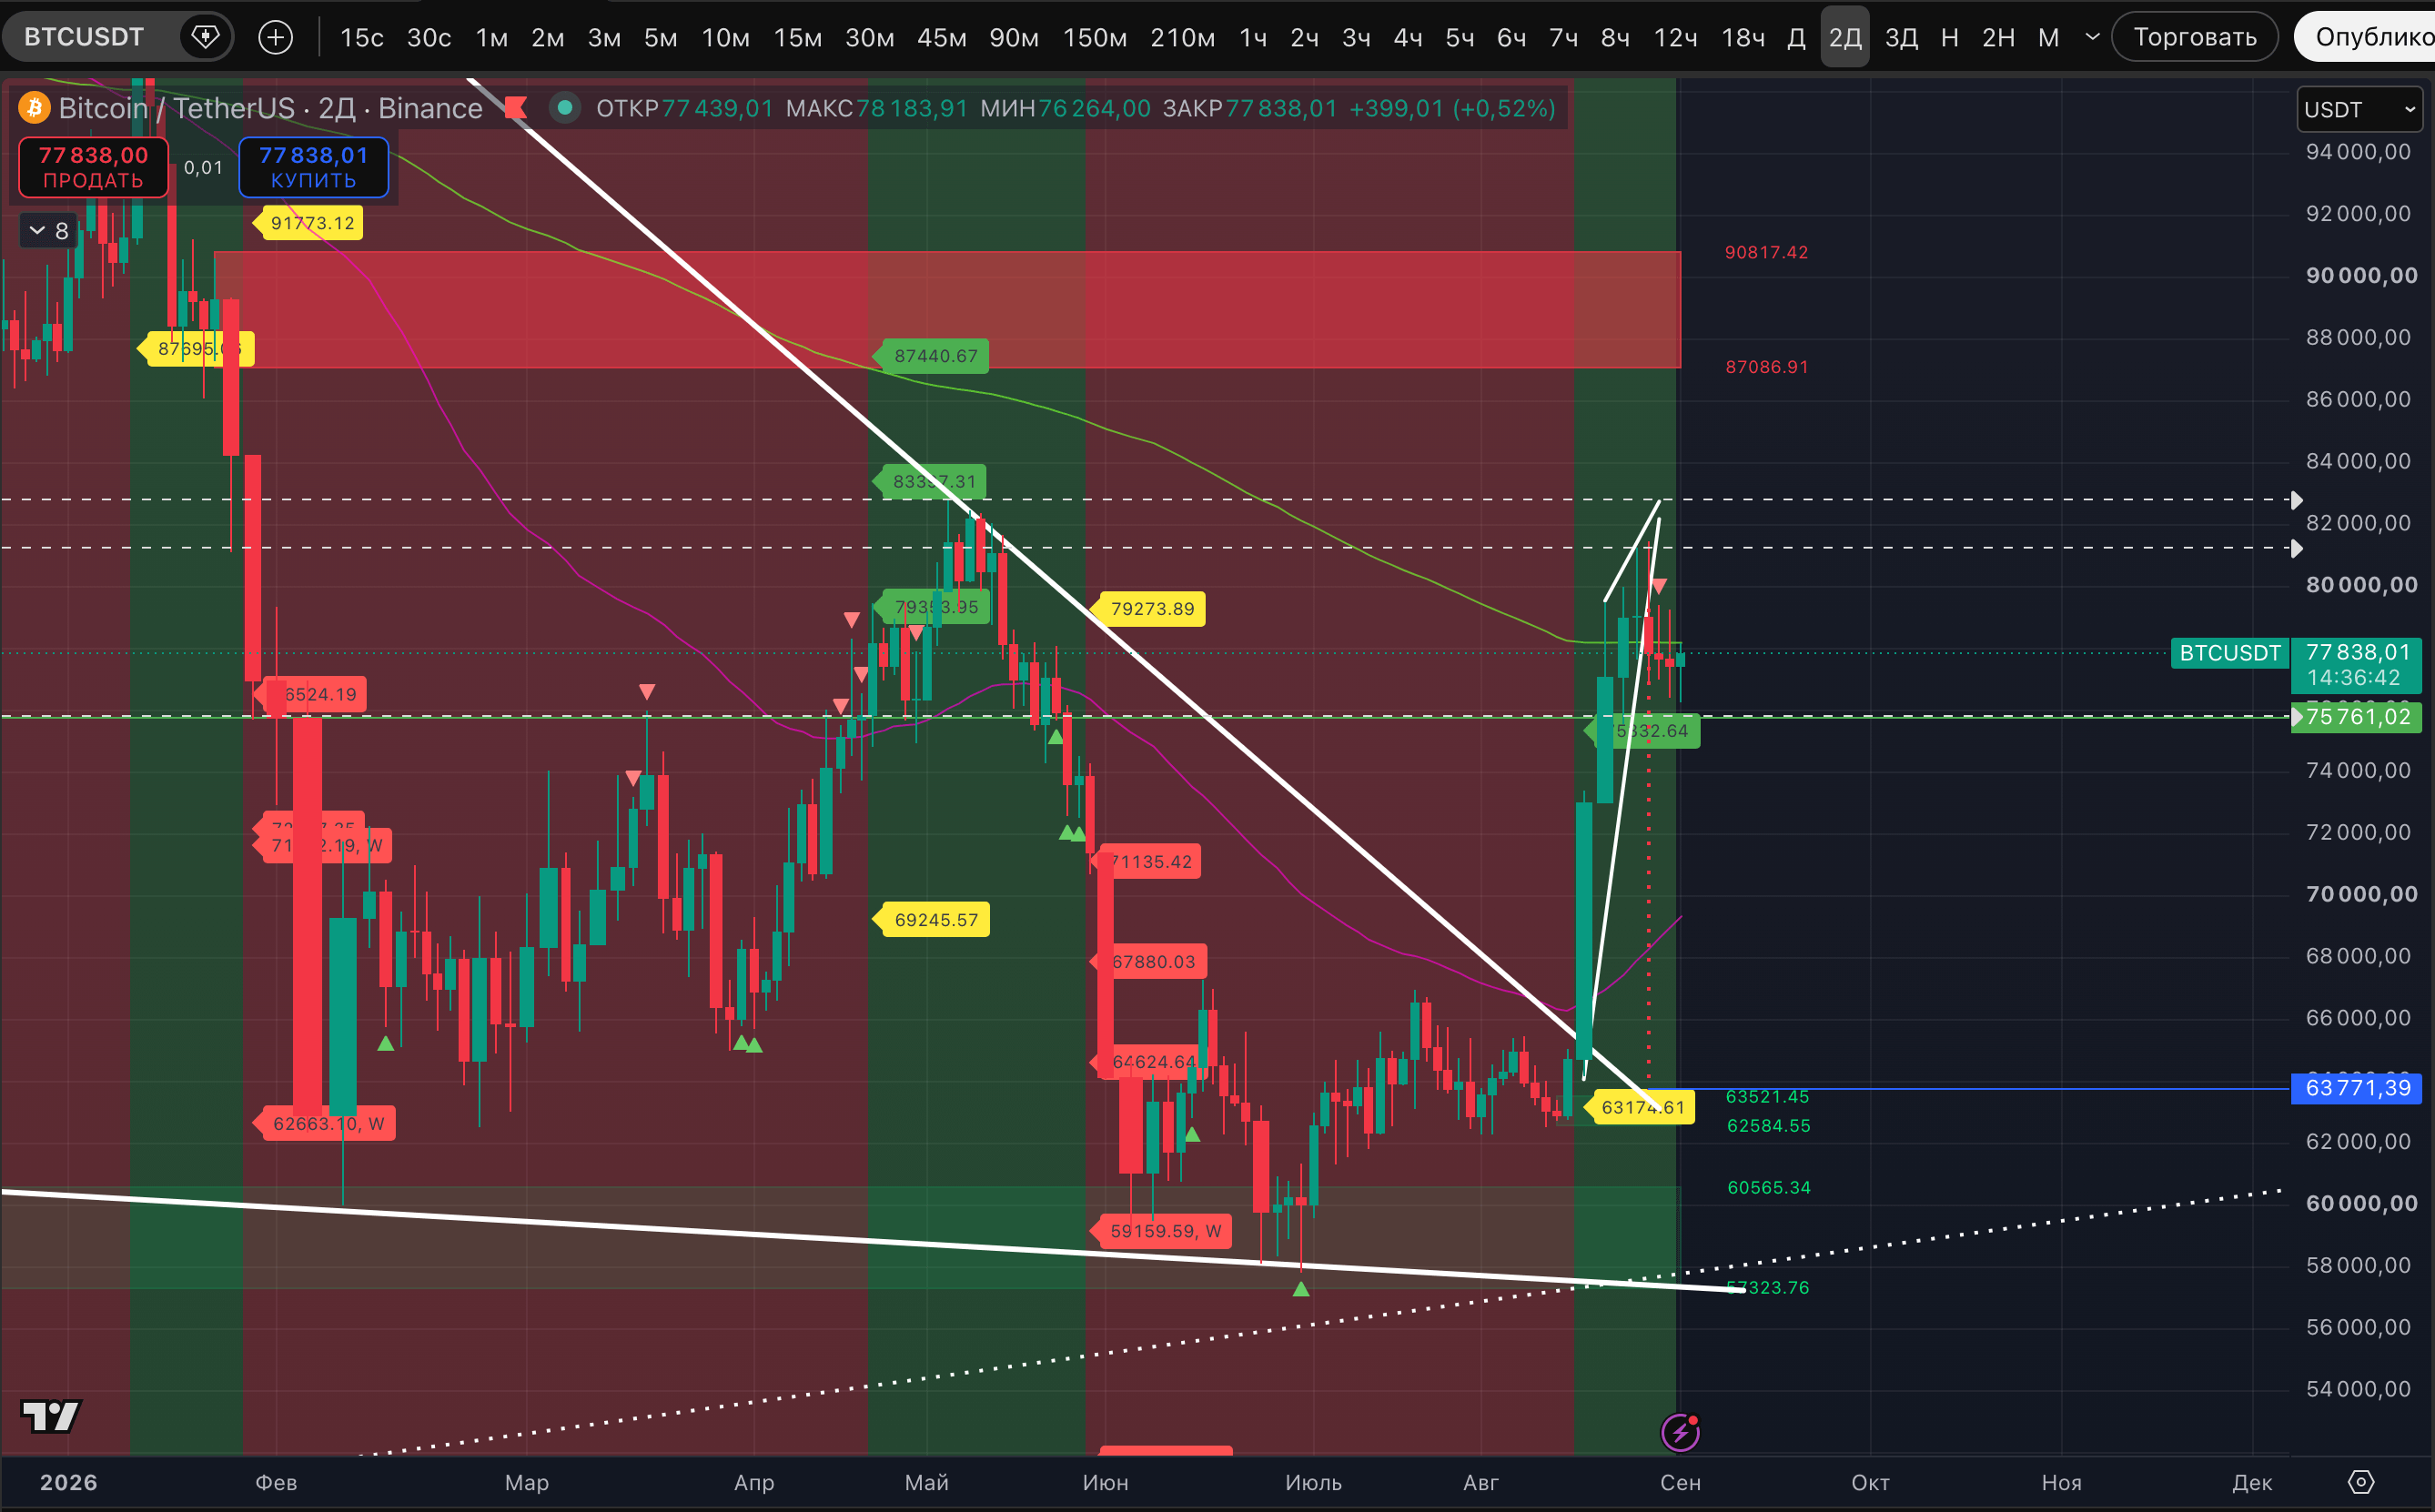
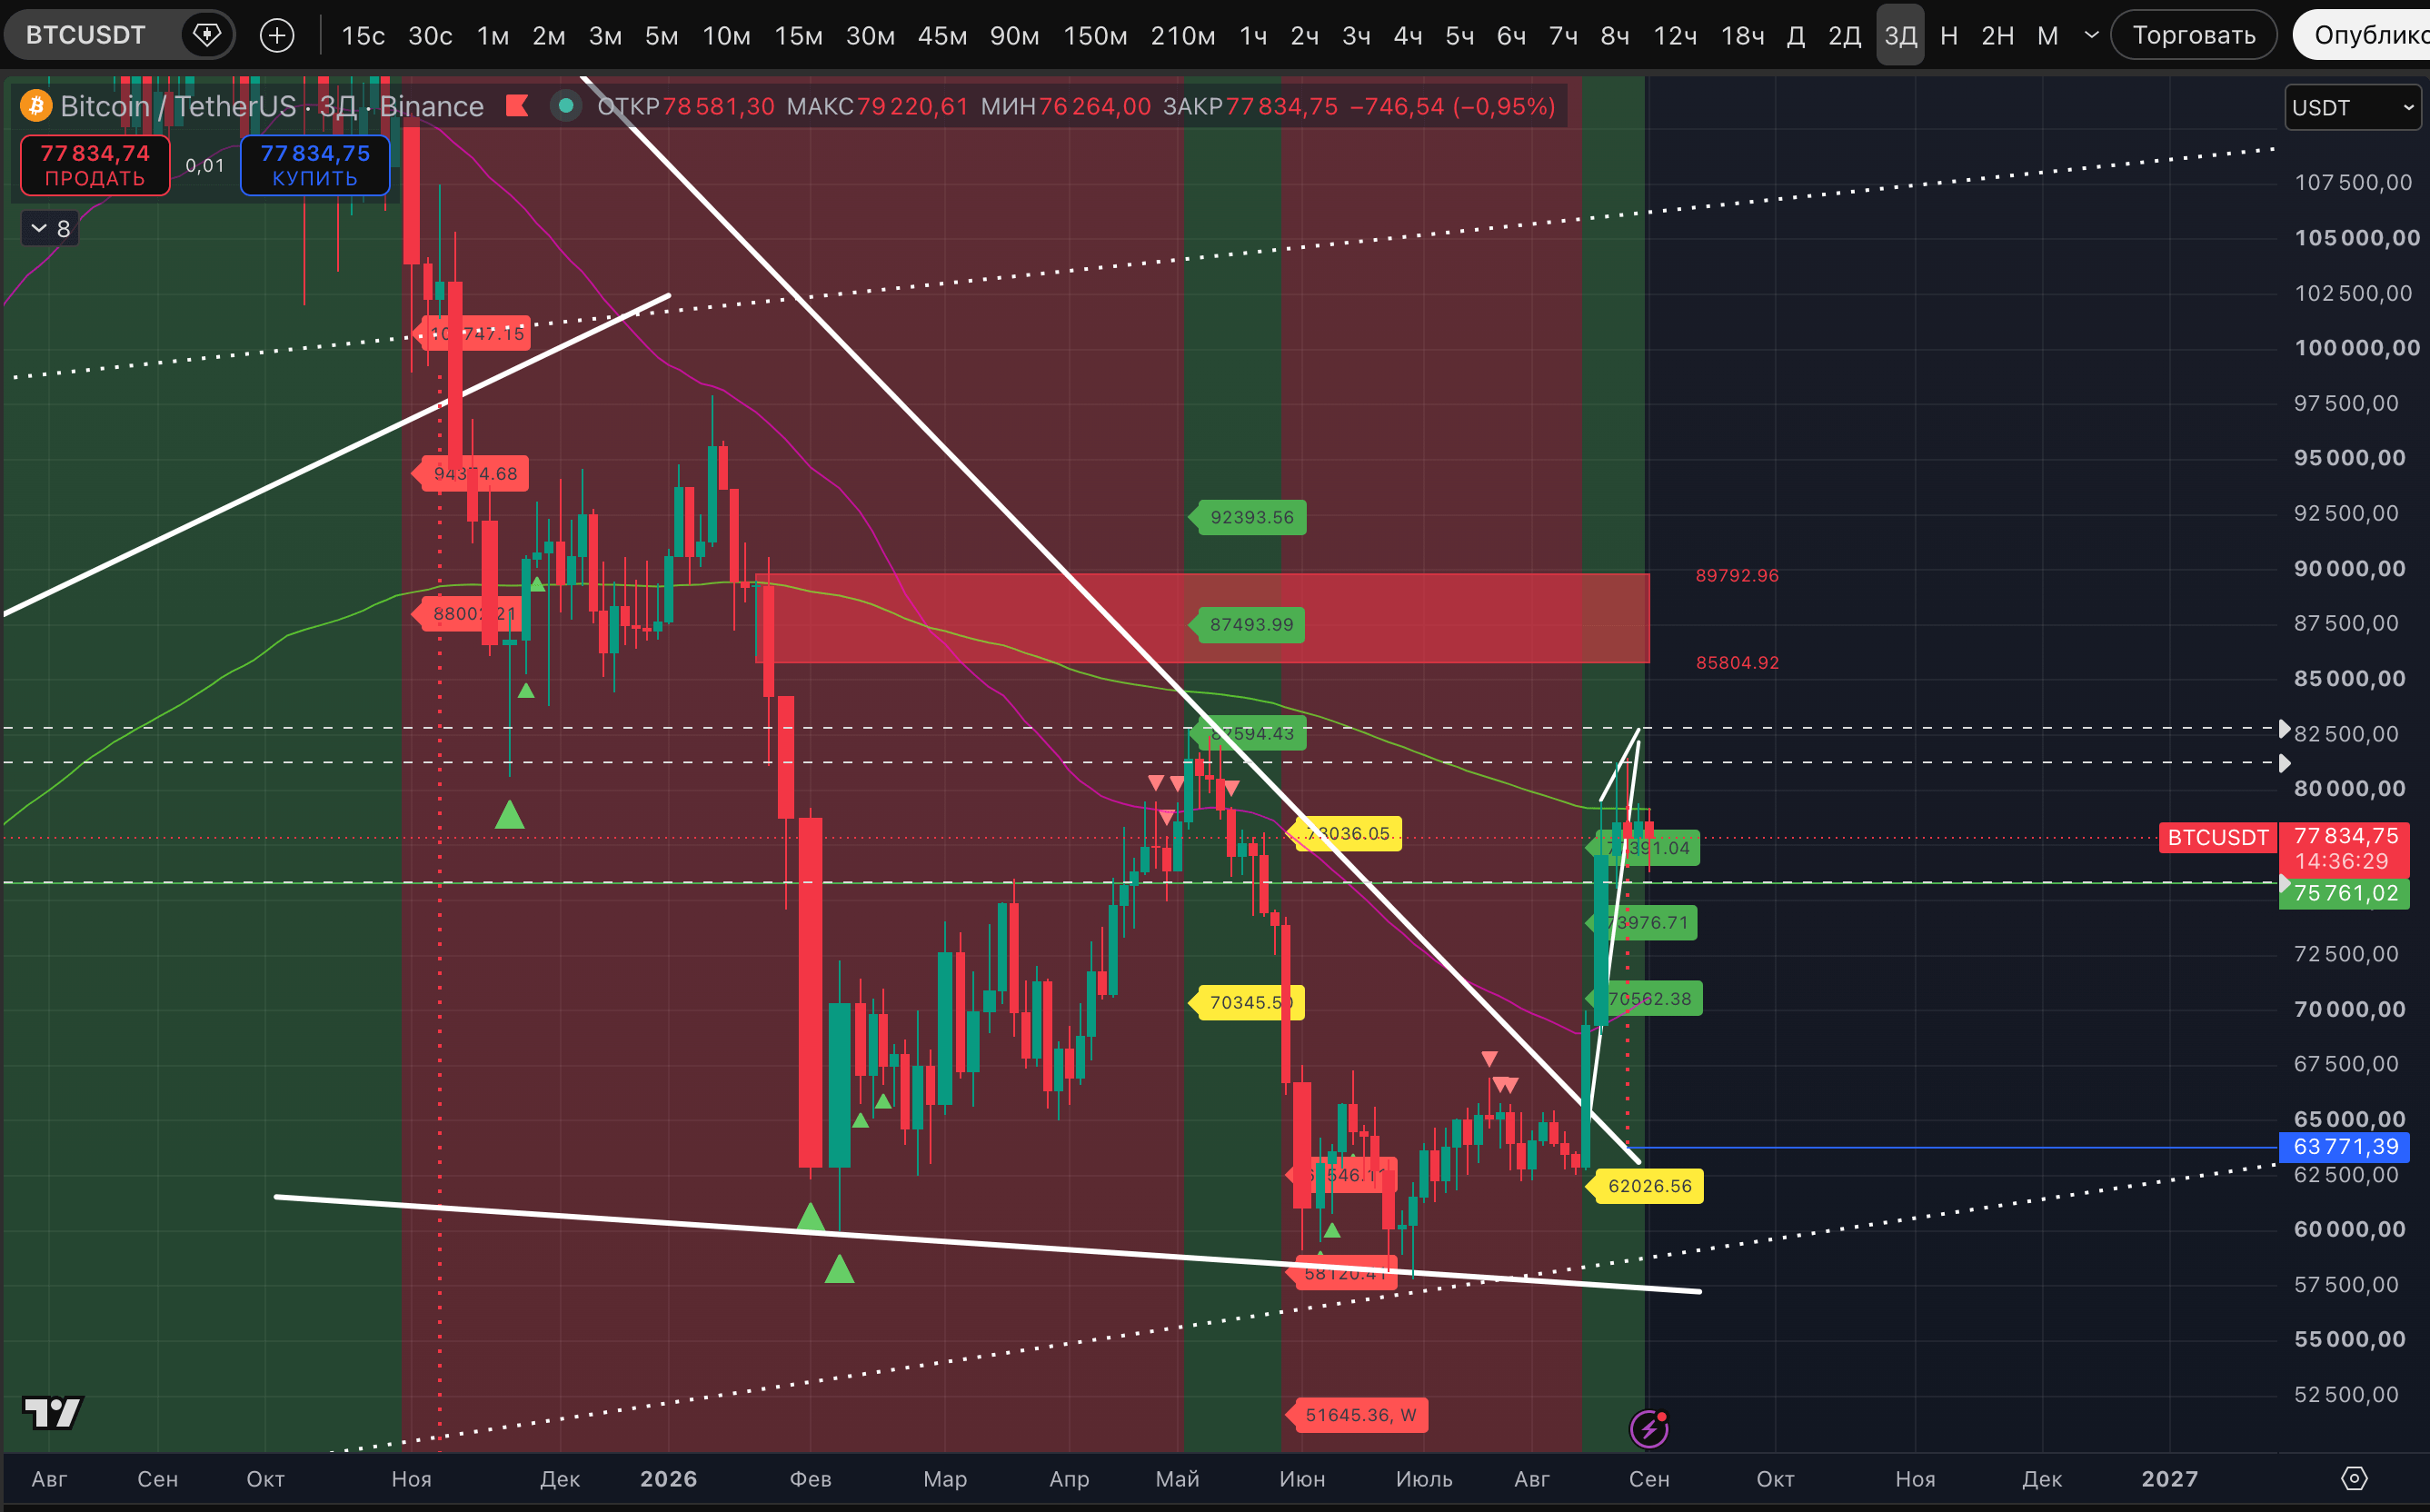
Plus, there is the 50 EMA on the weekly and 2-week timeframes—$77,347 and $78,502, respectively. These are strong resistances under which consolidation is currently taking place. The key question remains whether buyers can break through them without a pullback. We still believe they won’t.