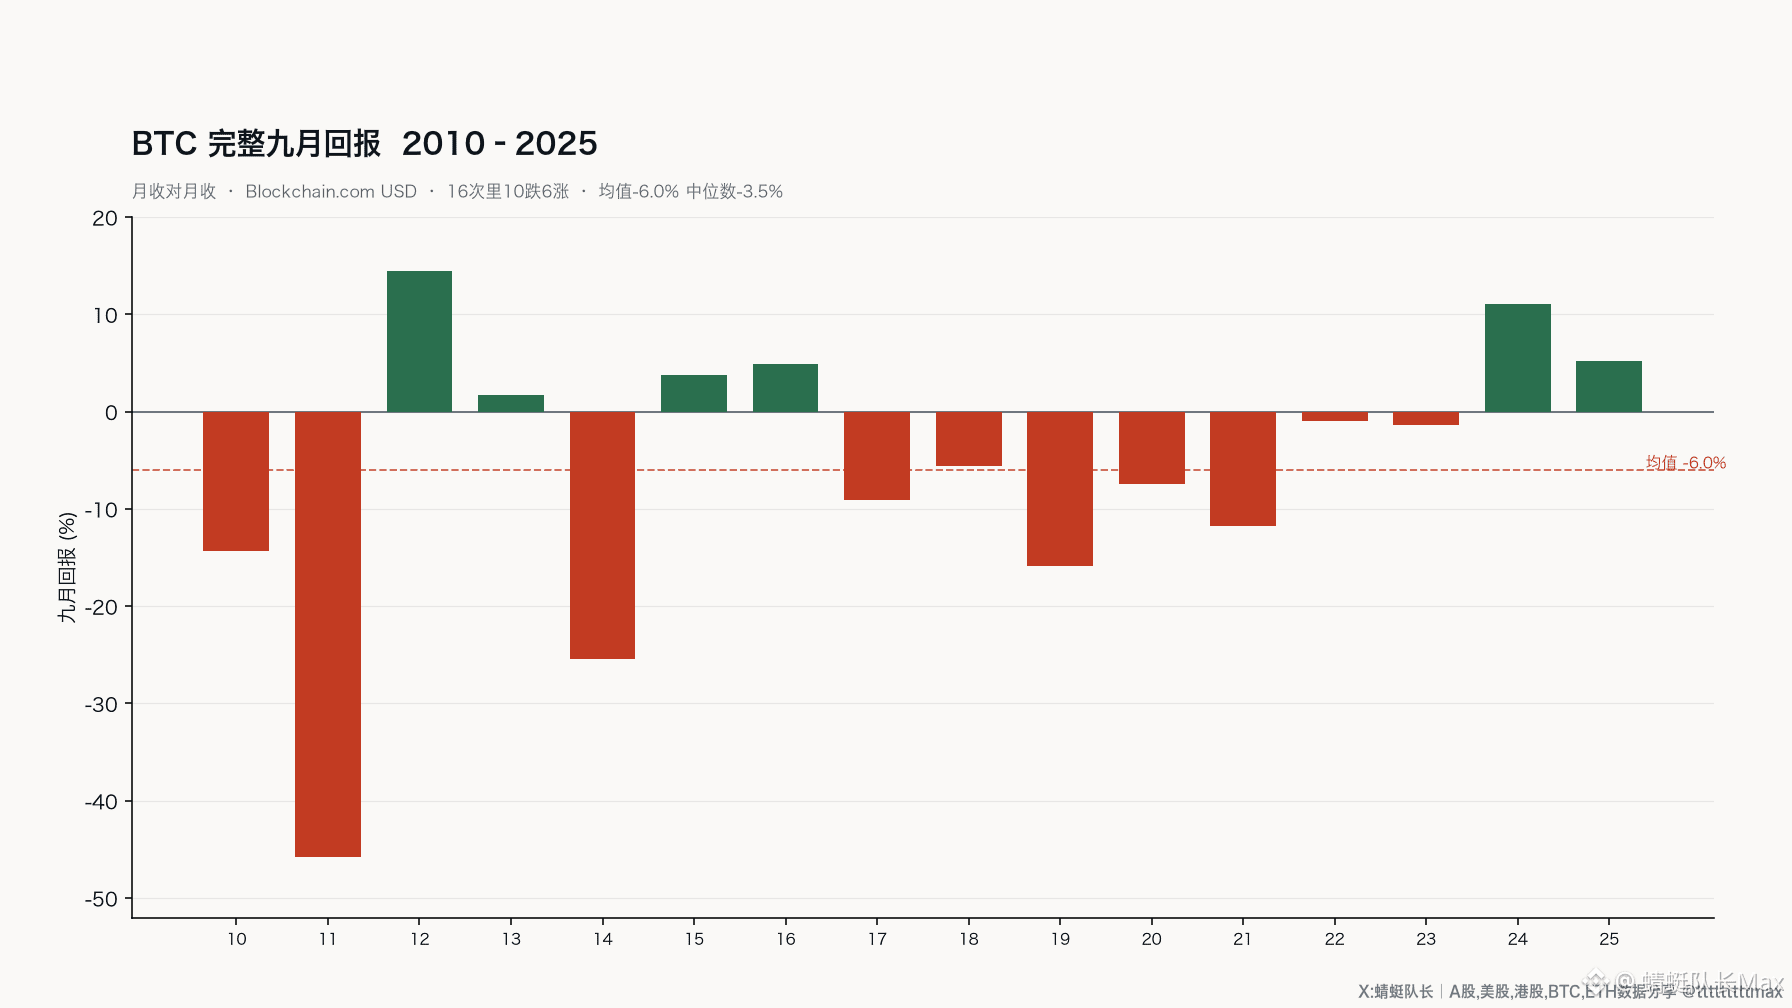
“BTC goes down every September” doesn’t add up to the accounting. From 2010 to 2025 there are 16 complete Septembers in total: 10 months closed down and 6 closed up. The average is -6.0%, the median is -3.5%—the worst column among the 12 months. But that streak of consecutive declines from 2017 to 2022 was interrupted in 2024 and 2025. Is this legend still being used as a trading rule?
The cover shows a bar chart of these 16 complete Septembers. Red bars mean declines, green bars mean gains, and the dashed line is the average of -6.0%. Monthly return is calculated as (the last day’s close of the month divided by the last day’s close of the previous month) minus one. The main source uses prices from Blockchain.com (USD). Starting in August 2017, the BTCUSDT monthly K-cross check uses Binance Vision. As of the cutoff date, September 3, 2026, the OKX spot price is about 77,730. September 2026 hasn’t finished yet, so it’s not included in the complete sample.
[How it actually goes in these 16 times]
(Refer to the structure diagram in the cover and the正文 image, and read it alongside the blue line swings and the Fib dashed lines on the right.)
The early years weren’t orderly. 2010: -14.3%, 2011: -45.8%, 2012: +14.5%, 2013: +1.7%, 2014: -25.4%, 2015: +3.7%, 2016: +4.9%. The sharpest drop was 2011 at -45.8%, and the clearest rise was 2012 at +14.5%.
Making the legend “hard” comes from the string that follows. Under the Blockchain.com definition, September was negative for seven consecutive years from 2017 to 2023: approximately -9.1%, -5.6%, -15.9%, -7.4%, -11.8%, -1.0%, and -1.4% respectively. In 2024 it was +11.0%, and in 2025 it was +5.2%. The consecutive declines were broken in these two years.
Using Binance spot data starting in 2017: there are 9 complete Septembers—6 down and 3 up—with an average of -3.0%. Here, 2023 is +3.9%. The two sides “argue” in 2023 because the August month-end closing price differs, so the K-line isn’t the same base candle. In both 2024 and 2025, the months were up.
[Weak doesn’t mean down every year]
In the long sample, September’s average really is the worst. The t-statistic is -1.62; with 16 data points it can’t pass the commonly cited 5% significance threshold, and seasonality vs. noise are hard to separate. That 2011 bar at -45.8% drags the mean down heavily.
Switching to the nine complete months from September 2017 onward on Binance: the average for June is -5.3%, which is worse than September’s -3.0%. People only remember September; the record shows June isn’t any cleaner.
As of September 3, 2026, the spot price is about 77,730. Compared with Blockchain.com’s August 31 close at 77,690, it’s almost flat from the start of the month. Compared with Binance’s August close at 78,581, it’s about -1.1%. The month hasn’t finished yet, so you can’t extend the narrative “yet again, a red September.”
[How to use it]
September can be observed as a “weak month,” not a switch that means “it must be down every year.” In the complete sample, 6 up months are already enough to falsify “every year.” The consecutive decline from 2017 to 2022 is true, and it’s also true that 2024 and 2025 turned positive. With only 16 data points, even a bad mean can’t support an ironclad rule.
Are you going to reduce exposure in advance because of the September legend, or wait for this month’s close and include 2024 and 2025 in the sample before deciding?
$BTC #比特币 #BTC #September
Captain of the Dragonfly | a finance blogger who likes analyzing data and candlestick charts.
Not investment advice. Monthly seasonality is used only to describe the sample. September 2026 hasn’t finished yet.
The cover shows a bar chart of these 16 complete Septembers. Red bars mean declines, green bars mean gains, and the dashed line is the average of -6.0%. Monthly return is calculated as (the last day’s close of the month divided by the last day’s close of the previous month) minus one. The main source uses prices from Blockchain.com (USD). Starting in August 2017, the BTCUSDT monthly K-cross check uses Binance Vision. As of the cutoff date, September 3, 2026, the OKX spot price is about 77,730. September 2026 hasn’t finished yet, so it’s not included in the complete sample.
[How it actually goes in these 16 times]
(Refer to the structure diagram in the cover and the正文 image, and read it alongside the blue line swings and the Fib dashed lines on the right.)
The early years weren’t orderly. 2010: -14.3%, 2011: -45.8%, 2012: +14.5%, 2013: +1.7%, 2014: -25.4%, 2015: +3.7%, 2016: +4.9%. The sharpest drop was 2011 at -45.8%, and the clearest rise was 2012 at +14.5%.
Making the legend “hard” comes from the string that follows. Under the Blockchain.com definition, September was negative for seven consecutive years from 2017 to 2023: approximately -9.1%, -5.6%, -15.9%, -7.4%, -11.8%, -1.0%, and -1.4% respectively. In 2024 it was +11.0%, and in 2025 it was +5.2%. The consecutive declines were broken in these two years.
Using Binance spot data starting in 2017: there are 9 complete Septembers—6 down and 3 up—with an average of -3.0%. Here, 2023 is +3.9%. The two sides “argue” in 2023 because the August month-end closing price differs, so the K-line isn’t the same base candle. In both 2024 and 2025, the months were up.
[Weak doesn’t mean down every year]
In the long sample, September’s average really is the worst. The t-statistic is -1.62; with 16 data points it can’t pass the commonly cited 5% significance threshold, and seasonality vs. noise are hard to separate. That 2011 bar at -45.8% drags the mean down heavily.
Switching to the nine complete months from September 2017 onward on Binance: the average for June is -5.3%, which is worse than September’s -3.0%. People only remember September; the record shows June isn’t any cleaner.
As of September 3, 2026, the spot price is about 77,730. Compared with Blockchain.com’s August 31 close at 77,690, it’s almost flat from the start of the month. Compared with Binance’s August close at 78,581, it’s about -1.1%. The month hasn’t finished yet, so you can’t extend the narrative “yet again, a red September.”
[How to use it]
September can be observed as a “weak month,” not a switch that means “it must be down every year.” In the complete sample, 6 up months are already enough to falsify “every year.” The consecutive decline from 2017 to 2022 is true, and it’s also true that 2024 and 2025 turned positive. With only 16 data points, even a bad mean can’t support an ironclad rule.
Are you going to reduce exposure in advance because of the September legend, or wait for this month’s close and include 2024 and 2025 in the sample before deciding?
$BTC #比特币 #BTC #September
Captain of the Dragonfly | a finance blogger who likes analyzing data and candlestick charts.
Not investment advice. Monthly seasonality is used only to describe the sample. September 2026 hasn’t finished yet.