


After surging 25% in August, it suddenly stalls—Bitcoin shows a “Simpsons pattern” again.
After Bitcoin’s ($BTC) strong rebound in August, it entered September but still failed to break through the $80,000 level. Over the past week, Bitcoin repeatedly tried to push into the $80,000 to $81,000 range but failed; the price then quickly dropped back to around $76,000 to $77,000. This also brought back to the spotlight the “Simpsons pattern” (Bart Simpson Pattern), familiar to many crypto traders.
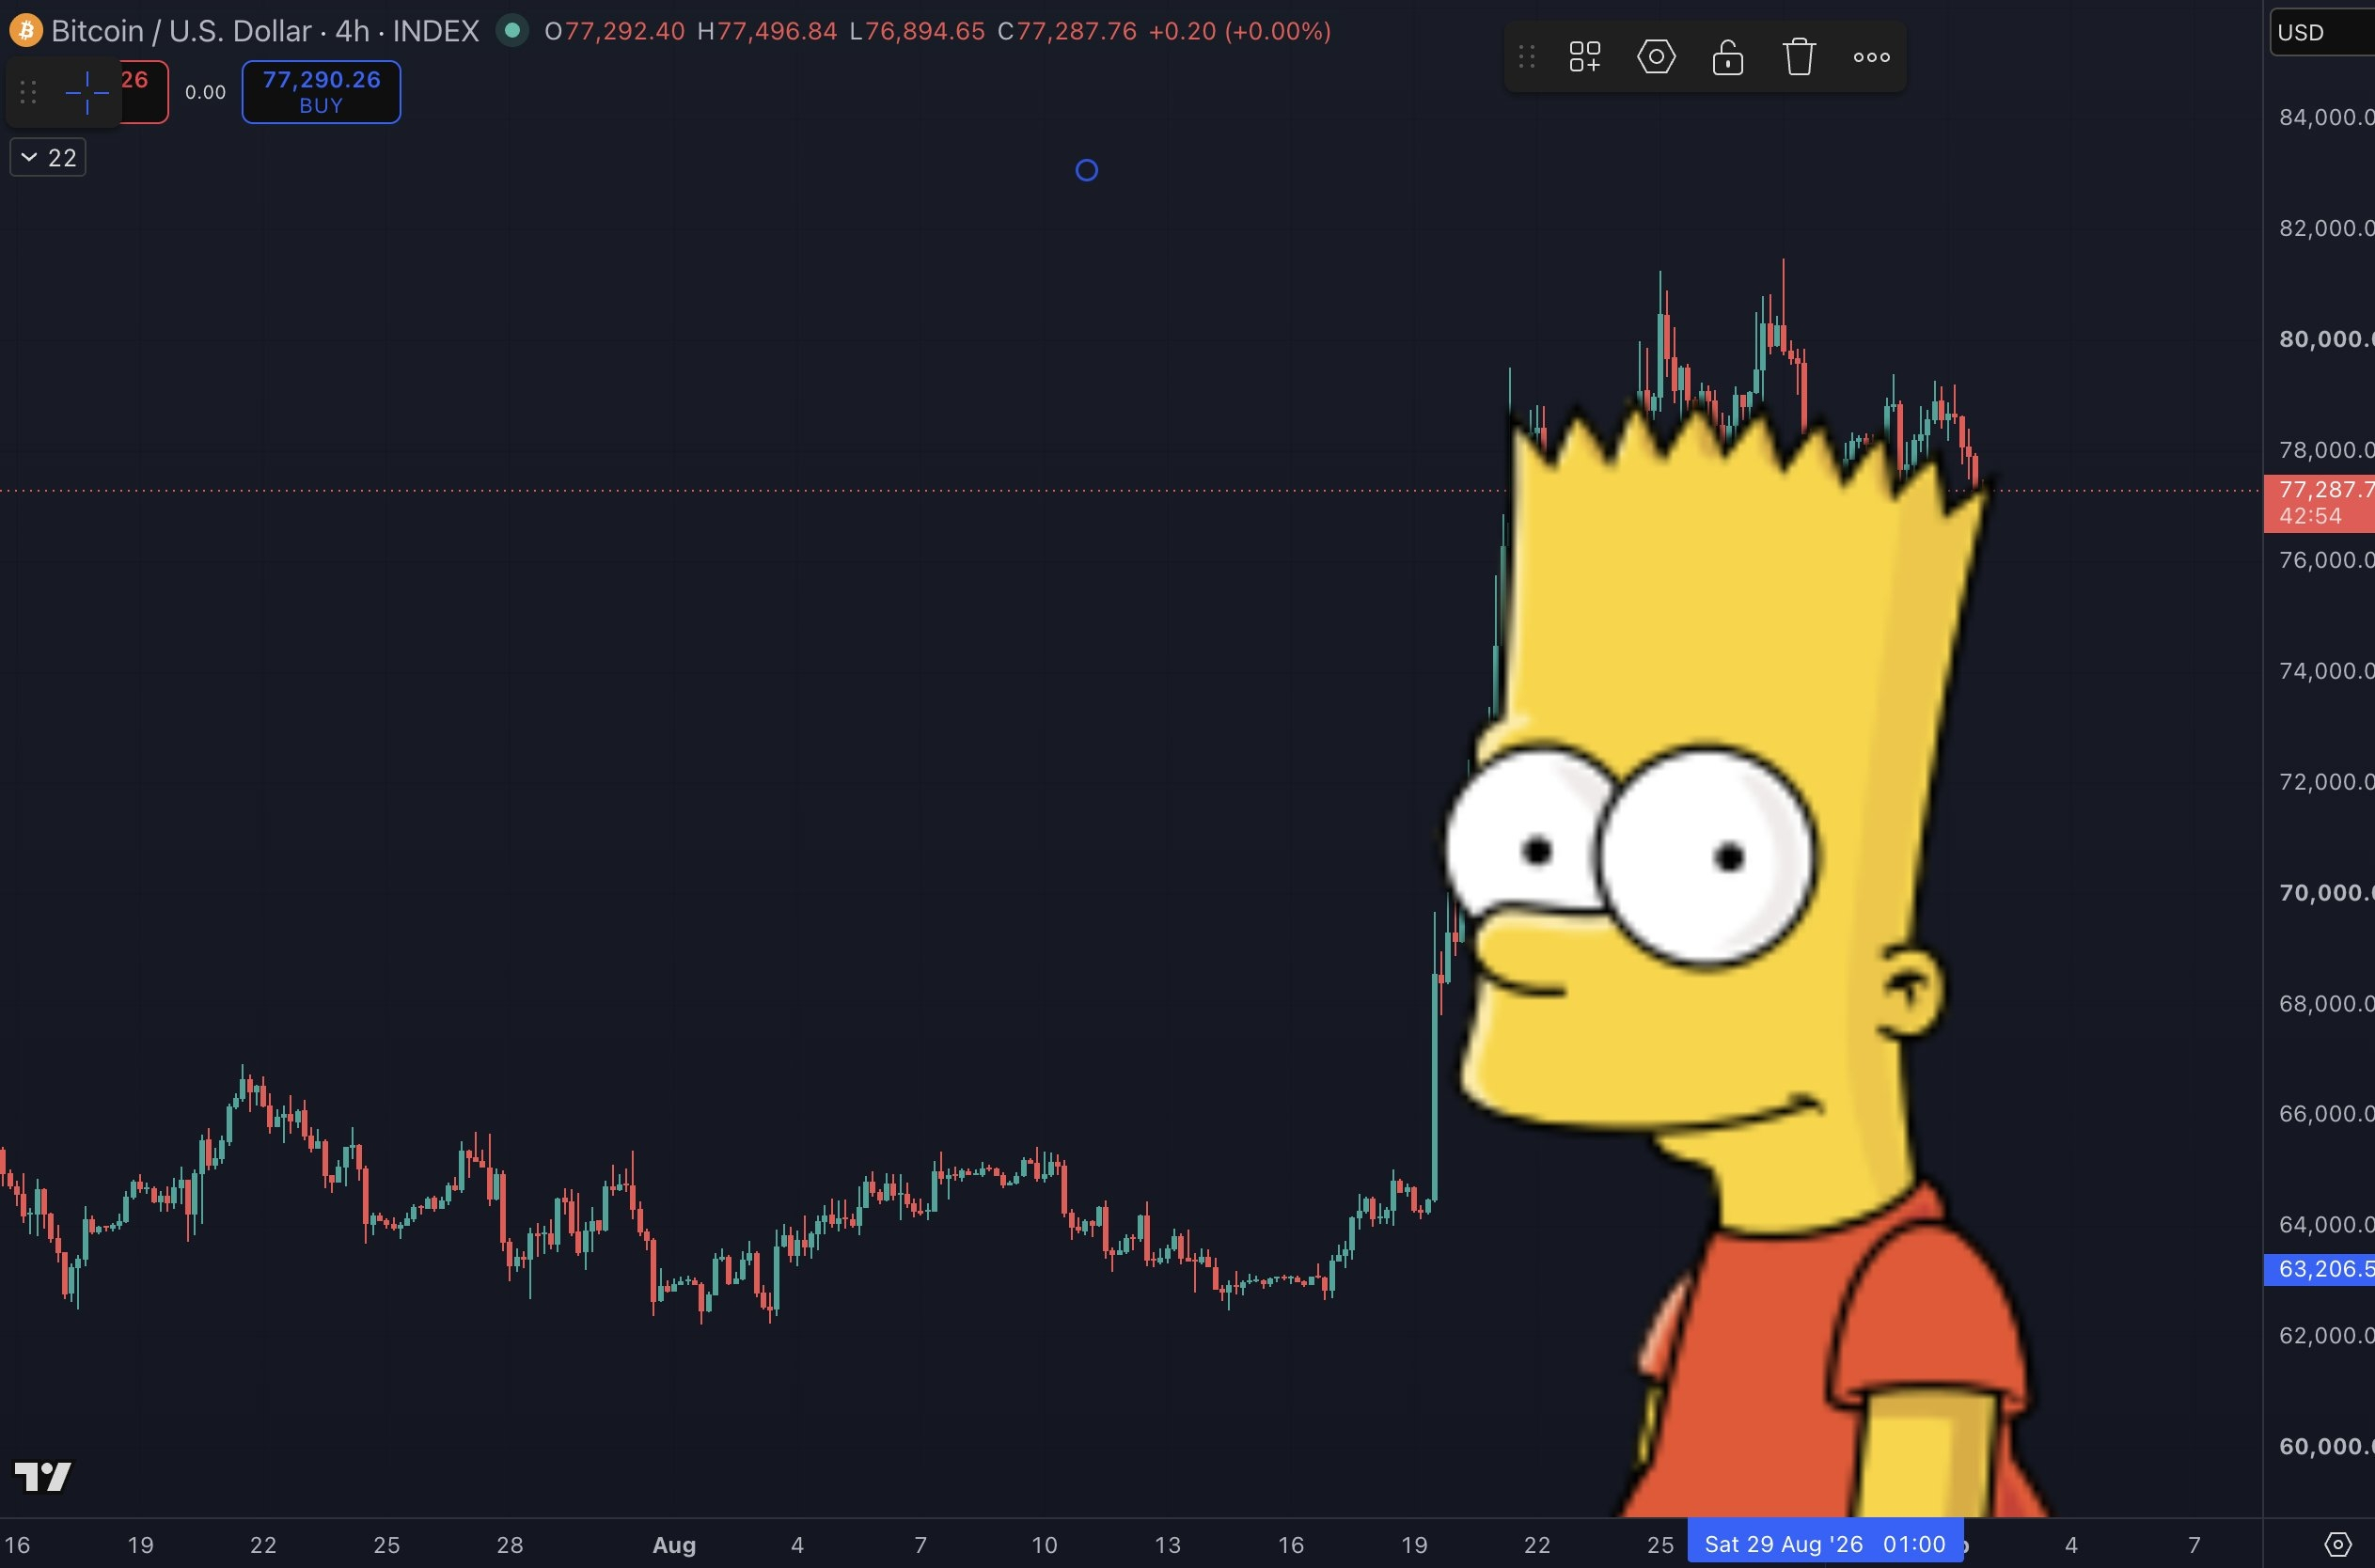 Source: X/@benjamincowen Bitcoin’s continued inability to break through $80,000 has once again brought the “Simpsons pattern” (Bart Simpson Pattern)—familiar to crypto traders—back into focus
On August 19, Bitcoin was around $64,420. In just six days, it surged to nearly $80,700, a gain of nearly 25%. It then entered a period of sideways consolidation and gradually fell back. This “rapid spike, top-side range, and price pullback” pattern—judging from the chart—resembles the spiky, jagged hair of Bart Simpson from the cartoon (The Simpsons). As a result, crypto traders call it the “Simpson pattern.”
This name is mainly circulated within the crypto trading community and is not an official technical indicator. A complete Simpson pattern typically shows a sharp price surge in a short time, followed by a period of oscillation within a narrow range, and then a rapid drop at a speed close to that of the initial climb—sometimes back to near the original breakout point.
Although Bitcoin has already pulled back from above $80,000, it has not yet formed a complete “Simpson flash crash.” Bitcoin’s 4-hour RSI is about 44.8, leaning weak, but still above 30, the level that typically signals oversold conditions. The 50-period indicator moving average is also still above the 200-period moving average, meaning the mid-term structure has not fully turned bearish. Analysts are currently watching a key level around $75,800. Only if price quickly breaks below this area will the risk of a fully formed Simpson pattern become clearly higher.
$80,000 keeps getting tested without breaking through; $81,000 forms clear sell pressure
Bitcoin’s biggest problem right now is the heavy sell pressure that has continued to appear above $80,000. In late August, Bitcoin briefly surged to around $81,281, but since then it has repeatedly failed to hold above $80,000 and has been pushed back by sellers. On September 2, the price fell to roughly the $76,500–$77,000 range, causing $80,000 to $81,000 to gradually form an important resistance zone for the market.
In addition to being a psychological integer milestone, this zone overlaps with Bitcoin’s 50-week moving average and the supply zones left behind by the first few rounds of rebounds earlier this year. Every time price enters this zone, it meets sell pressure, making it difficult for the bulls to push the rally further.
Below that, $76,500 to $78,000 has become an important support zone in the near term. If buying can hold this level, the rebound structure formed in August may still have a chance to continue. If it clearly breaks down, the next phase of the market may further test $74,500 and even around $72,000.
Nansen senior research analyst Nicolai Søndergaard believes that Bitcoin must first regain stability above $77,400 to $77,650 before it has a chance to challenge $80,000 again. If spot trading volume and ETF fund flows improve in sync, and meanwhile the funding rates on perpetual contracts remain moderate, the sustainability of the rebound would be clearer.
ETF fund inflows start to cool down; Nansen: the bull market is not confirmed yet
Notably, Bitcoin has just passed through an exceptionally strong August. According to André Dragosch, Bitwise’s head of European research, Bitcoin rose about 25% in August, marking the third-best August performance in history, behind only 2017’s 65.6% and 2013’s 30.7%. U.S. spot Bitcoin ETFs also attracted a large amount of capital in August, becoming one of the key forces driving this rebound.
However, after the end of the month, ETF fund momentum began to cool. On August 28, U.S. spot Bitcoin ETFs recorded about a $202 million net outflow, ending the streak of net inflows for the prior nine straight trading days. Nansen data also showed that, over the past week, the tracked on-chain addresses net transferred about 3,700 bitcoins to exchanges. Moving Bitcoin to exchanges does not necessarily mean it will be sold immediately, but it is often viewed by the market as a signal that potential sell pressure may increase.
Large investors are also split on positioning. The whales tracked by Nansen still maintain a modest net long position overall, but large trading accounts on Hyperliquid hold heavier short positions. Open interest is falling, and active trade data also indicates that sellers still have a certain advantage.
Søndergaard therefore believes that the roughly 22% rebound in Bitcoin over the past month has indeed improved market structure, but current spot fund flows are still not sufficient to confirm that a new bull market has already begun.
U.S.-Iran conflict and rate-hike expectations hit at the same time—$76,000 becomes the bulls’ defense line
Beyond technicals and fund flows, Bitcoin is also facing a more complex macroeconomic environment.
After tensions between the United States and Iran escalated, risk-averse sentiment in the market increased rapidly. Bitcoin briefly fell to below about $76,500, while Brent crude oil broke above $90 per barrel, and U.S. Treasury yields rose in tandem.
Rising oil prices could reignite market worries about inflation and further affect expectations for the Federal Reserve’s monetary policy. Federal Reserve Chair Kevin Warsh recently said at the Jackson Hole Global Central Banks Conference that the pace of U.S. inflation declining is still not sufficient, prompting the market to increase its bets on a Fed rate hike.
Related news: Bitcoin breaks below $78,000! Fed Chair Warsh turns hawkish, and the probability of rate hikes soars above 56%
In the past, Bitcoin has typically benefited from a relatively loose liquidity environment. Therefore, higher rate-hike expectations and rising Treasury yields could limit the upside space for short-term risk assets. On the other hand, with Bitcoin facing oil prices breaking above $90, rising bond yields, and pressure on the stock market, it is still broadly holding within the $76,000 to $80,000 range.
At the moment, market attention is gradually concentrating around $76,000. Nansen views $76,400 as an important downside level—once it is breached, leveraged long positions may face greater pressure. If Bitcoin can reclaim $77,400 to $77,650, then the market will have conditions to challenge $80,000 again.
The chart has already begun to show a shape similar to the “Simpson pattern,” but the complete flash-crash structure has not been confirmed yet. Next, the market will continue to watch support around $76,000 and the movements of spot and ETF funds.
“Bitcoin returns to the Simpson pattern! After a 25% surge in August, it sputters out; Nansen: the bull market has not been confirmed.” This article was first published on “Crypto City.”