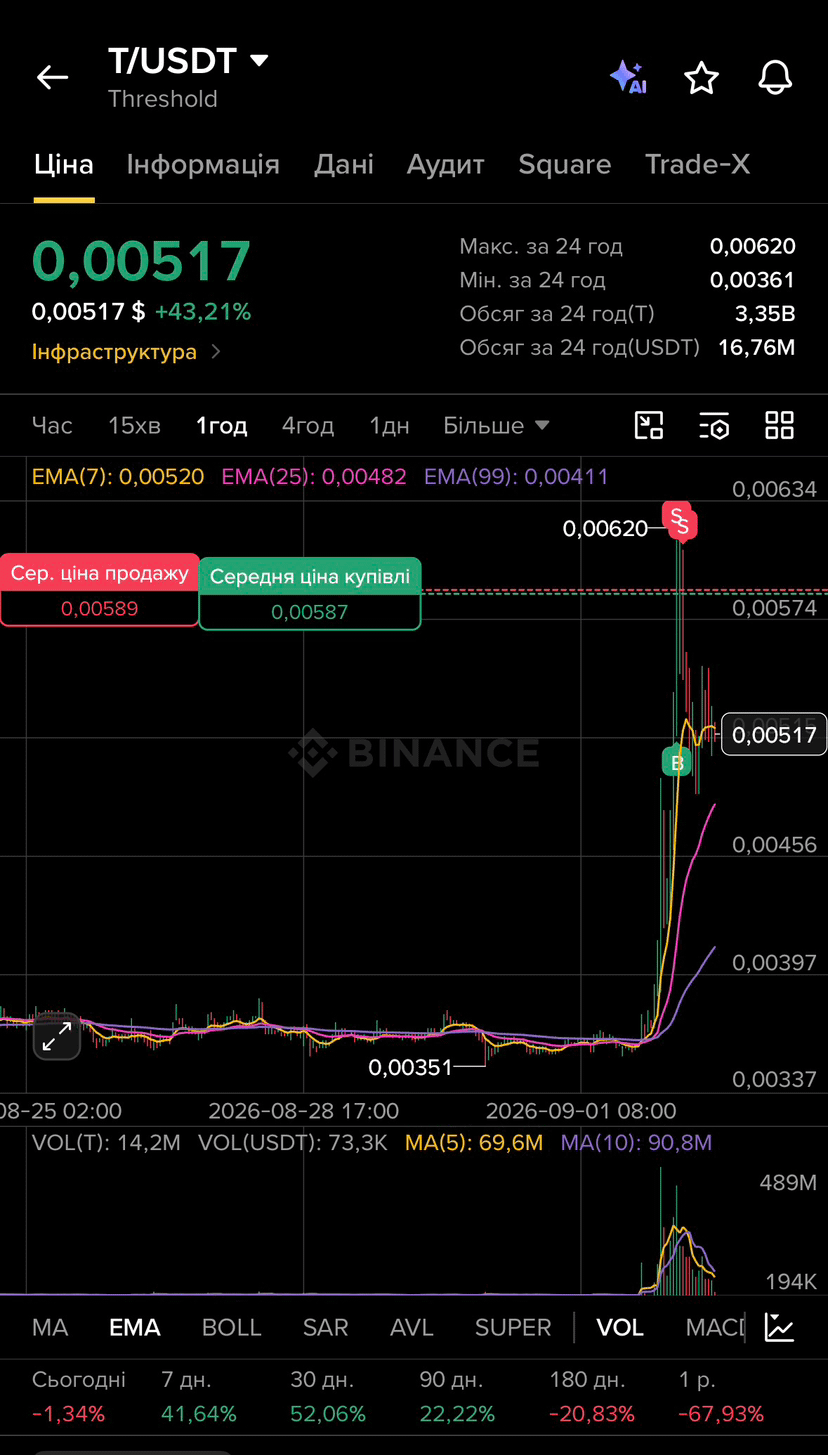

🚀 **Threshold (T) shows explosive growth: +43% per day!**
The **T/USDT** coin has demonstrated a strong impulsive breakout from a zone of prolonged accumulation. Let’s break down what’s happening on the 1-hour chart and what to expect next.
📊 **Key metrics:**
• **Current price:** 0,00517 USDT
• **24h High:** 0,00620 USDT
• **Daily volume:** 16,76M USDT (3,35 billion T coins)
🔍 **Chart and trend analysis:**
After a long sideways consolidation around 0,00351 USDT, a large amount of buyers entered the market, triggering a rally to a local high of 0,00620 USDT. Right now, the price is in a natural correction and consolidation phase after profit-taking.
• **Support:** The nearest dynamic support zone runs near **EMA(25)** at **0,00482 USDT**.
• **Resistance:** The main obstacle to continuing the “bullish” rally is the **0,00620 USDT** mark.
💡 **Summary:**
The overall short-term trend is strongly bullish, but after such drawdowns, entering “at the highs” carries a high risk. It’s worth watching how the price reacts to the EMA(25) level to find safer entry points.
Always follow risk management and DYOR!
#Threshold
The **T/USDT** coin has demonstrated a strong impulsive breakout from a zone of prolonged accumulation. Let’s break down what’s happening on the 1-hour chart and what to expect next.
📊 **Key metrics:**
• **Current price:** 0,00517 USDT
• **24h High:** 0,00620 USDT
• **Daily volume:** 16,76M USDT (3,35 billion T coins)
🔍 **Chart and trend analysis:**
After a long sideways consolidation around 0,00351 USDT, a large amount of buyers entered the market, triggering a rally to a local high of 0,00620 USDT. Right now, the price is in a natural correction and consolidation phase after profit-taking.
• **Support:** The nearest dynamic support zone runs near **EMA(25)** at **0,00482 USDT**.
• **Resistance:** The main obstacle to continuing the “bullish” rally is the **0,00620 USDT** mark.
💡 **Summary:**
The overall short-term trend is strongly bullish, but after such drawdowns, entering “at the highs” carries a high risk. It’s worth watching how the price reacts to the EMA(25) level to find safer entry points.
Always follow risk management and DYOR!
#Threshold