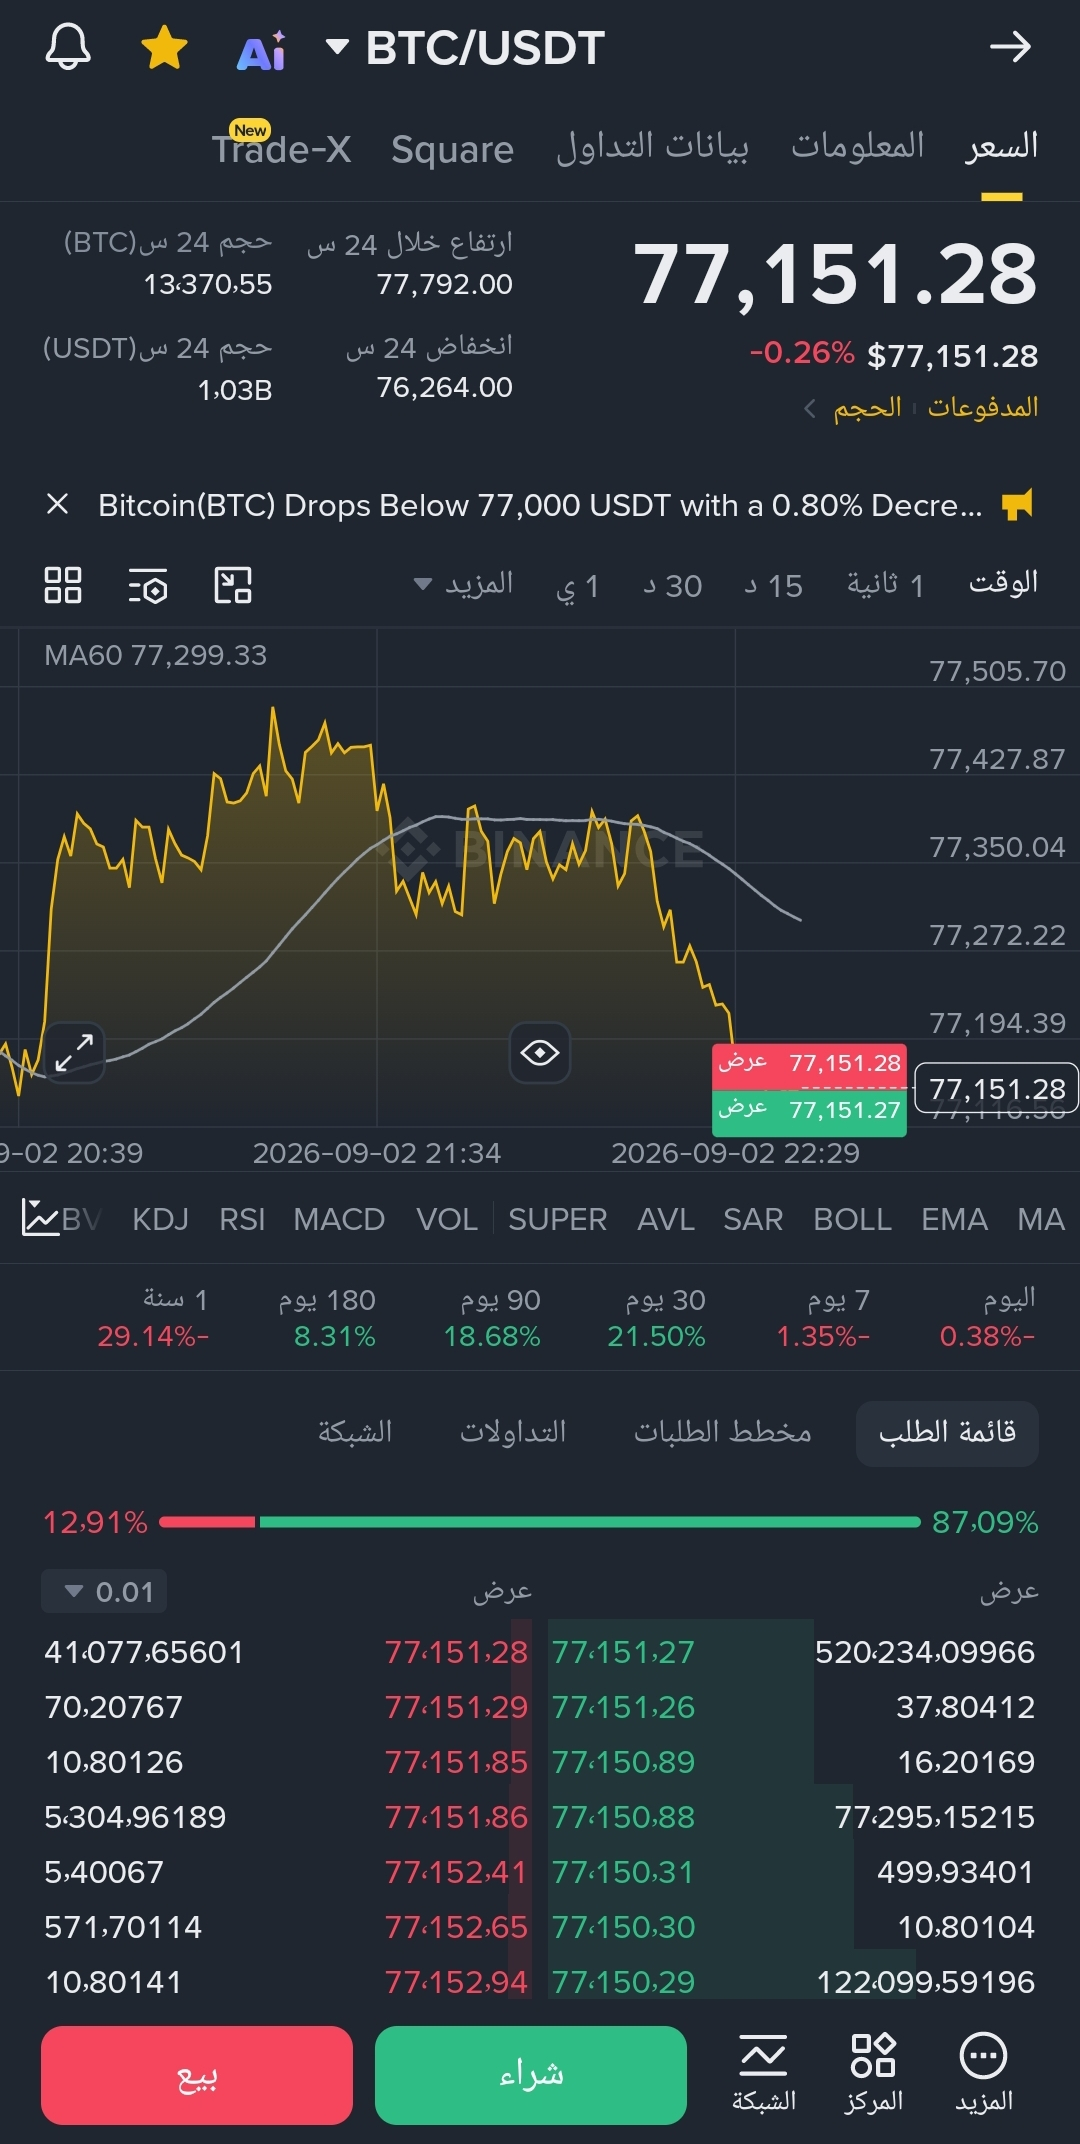
Fluctuation before the breakout? Liquidity map analysis for $BTC and the big players! 🔥
The beginner investor sees this minor dip (-0.8%) as a "weakness in the market," while the experienced trader knows the value of these zones: it’s a phase of liquidity re-accumulation (Re-accumulation) and testing the strength of the rising channel!
📊 Quick reading of the current map:
BTC ($77,924.55): Bitcoin successfully defends the key support level between $77,000 and $78,000 on the daily timeframe, increasing the likelihood of a rebound back toward the $80k zones.
$BNB ($686.94): Proves once again that it’s the least affected by pullbacks (-0.4% only), reflecting the strength of internal investment flows within the ecosystem.
$ETH ($2,448.96) & $SOL ($102.04): Solana holds above the psychological $100 barrier, and with normal accumulation signals on Ethereum, it shows that liquidity is getting ready to rotate (Market Rotation) as soon as the market leader stabilizes.
💡 My trading plan for today:
I’m watching how price behaves around the $77.8k level for confirmation. You can check the live chart and manage your trades directly via the tool attached to the post 👇.
💬 Followers question: Do you buy this small dip (Buy the Dip) or are you waiting for the daily candle to close? Share your analysis!
#BinanceSquare #CryptoAnalysis #Write2Earn #bitcoin #tradingtips
The beginner investor sees this minor dip (-0.8%) as a "weakness in the market," while the experienced trader knows the value of these zones: it’s a phase of liquidity re-accumulation (Re-accumulation) and testing the strength of the rising channel!
📊 Quick reading of the current map:
BTC ($77,924.55): Bitcoin successfully defends the key support level between $77,000 and $78,000 on the daily timeframe, increasing the likelihood of a rebound back toward the $80k zones.
$BNB ($686.94): Proves once again that it’s the least affected by pullbacks (-0.4% only), reflecting the strength of internal investment flows within the ecosystem.
$ETH ($2,448.96) & $SOL ($102.04): Solana holds above the psychological $100 barrier, and with normal accumulation signals on Ethereum, it shows that liquidity is getting ready to rotate (Market Rotation) as soon as the market leader stabilizes.
💡 My trading plan for today:
I’m watching how price behaves around the $77.8k level for confirmation. You can check the live chart and manage your trades directly via the tool attached to the post 👇.
💬 Followers question: Do you buy this small dip (Buy the Dip) or are you waiting for the daily candle to close? Share your analysis!
#BinanceSquare #CryptoAnalysis #Write2Earn #bitcoin #tradingtips