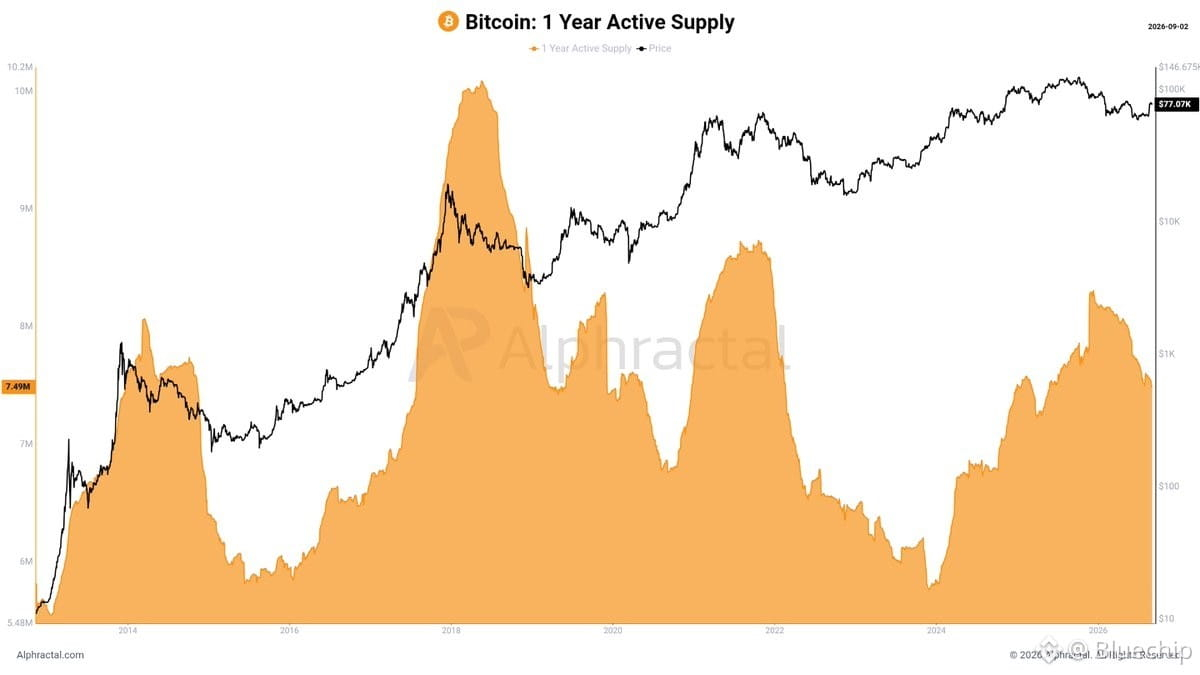

$BTC ’s 1-Year Active Supply tends to decline during Bear Market movements.
Historically, when the market enters a prolonged downturn, fewer coins move within the 1-year window. Market activity cools down, speculation decreases, and a larger share of BTC remains untouched for more than 12 months.
The chart shows this behavior quite clearly across different cycles.
Currently, the metric has fallen again to around 7.49 million BTC, indicating a reduction in the amount of Bitcoin that has been active over the past year.
This does not necessarily mean the bottom is already in, but it highlights a common Bear Market characteristic: less Bitcoin circulating and more coins aging in holders’ wallets.
Historically, when the market enters a prolonged downturn, fewer coins move within the 1-year window. Market activity cools down, speculation decreases, and a larger share of BTC remains untouched for more than 12 months.
The chart shows this behavior quite clearly across different cycles.
Currently, the metric has fallen again to around 7.49 million BTC, indicating a reduction in the amount of Bitcoin that has been active over the past year.
This does not necessarily mean the bottom is already in, but it highlights a common Bear Market characteristic: less Bitcoin circulating and more coins aging in holders’ wallets.