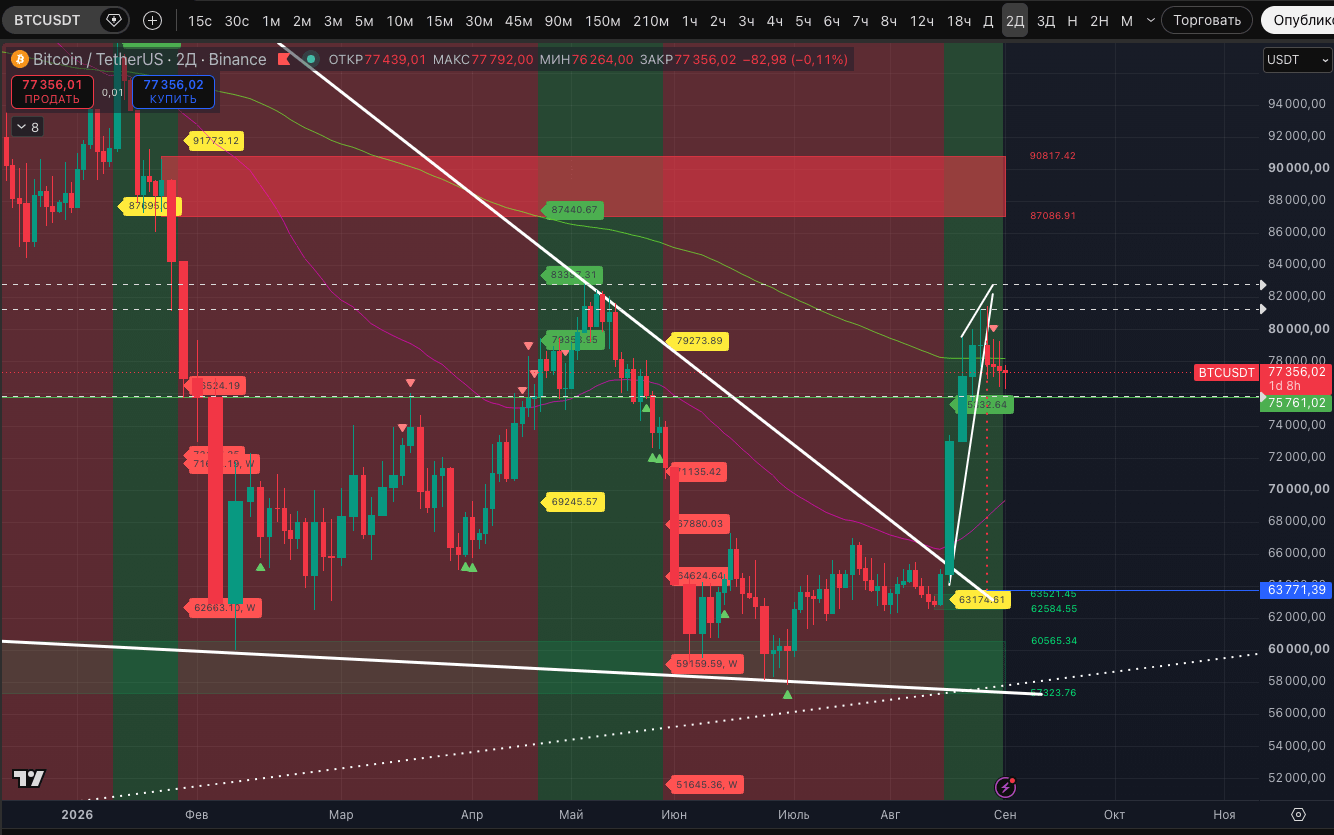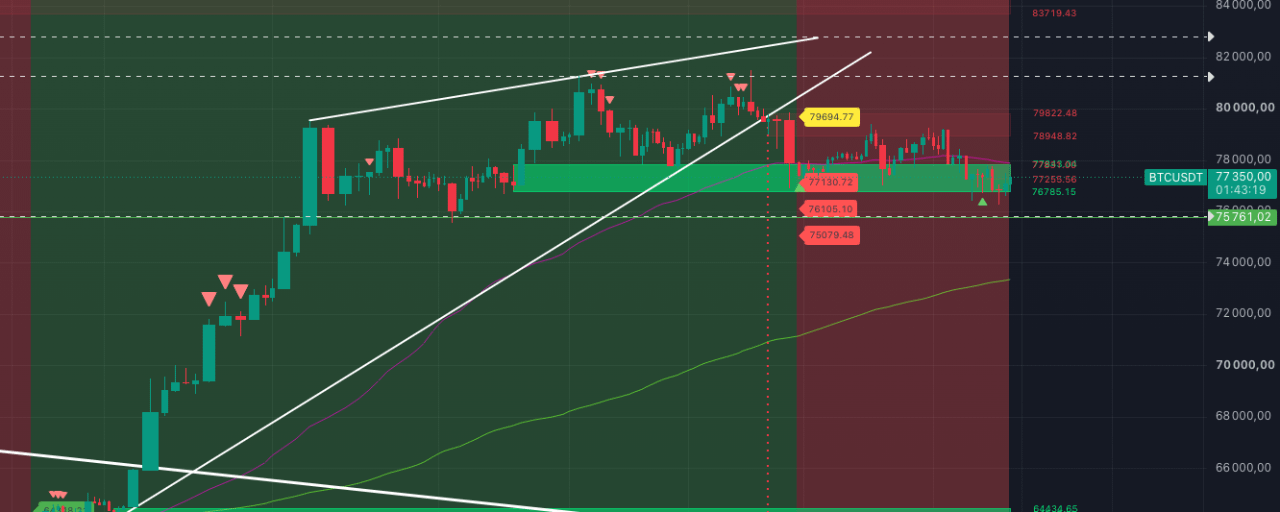


For BTC bulls, an important support range of $76,785–$77,843 is still being held. Which was mentioned both yesterday and the day before yesterday.
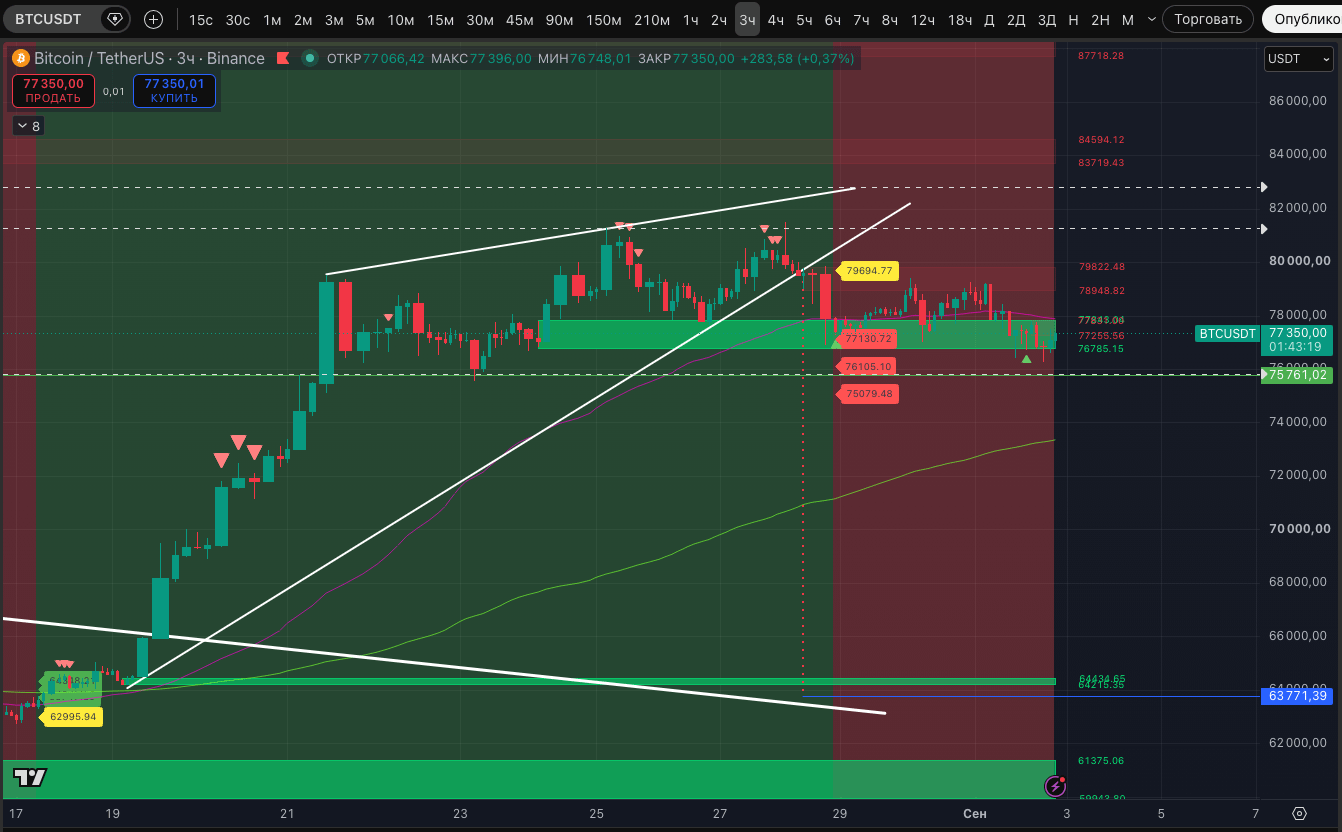
This is a liquidity zone on the 3-hour timeframe. Which, since August 28, sellers have been consistently testing and building a chart with decreasing highs and lows. BUT—it's still not been absorbed.
Yesterday and today were squeezes below this zone, but in the end each time buyers stretch the situation and close the 3-hour candle above the 76,785$ level.
In fact, since August 21 the price has been holding in a range, and the question is whether it’s distribution or accumulation. We think it is distribution and, as before, we’re skeptical about the scenario of further growth.
And not only because at night there was a break of the sustained uptrend on the 2.5-hour timeframe. We also take into account that #ETH on the 3-hour chart (by the way, also already on the 4-hour) has shifted into a sustained downtrend (against the backdrop of high marks on the daily, 3-day, and weekly timeframes). And that some altcoins today (including XRP) have also shifted into a downtrend on the 12-hour timeframe.
This picture does NOT exclude that within the distribution, the price could trade in a range for some more time and show a move from the current bounce. For BTC, this is supported by marks of potential lows on the 4-hour timeframe (already three) and on the 5-hour timeframe (two).
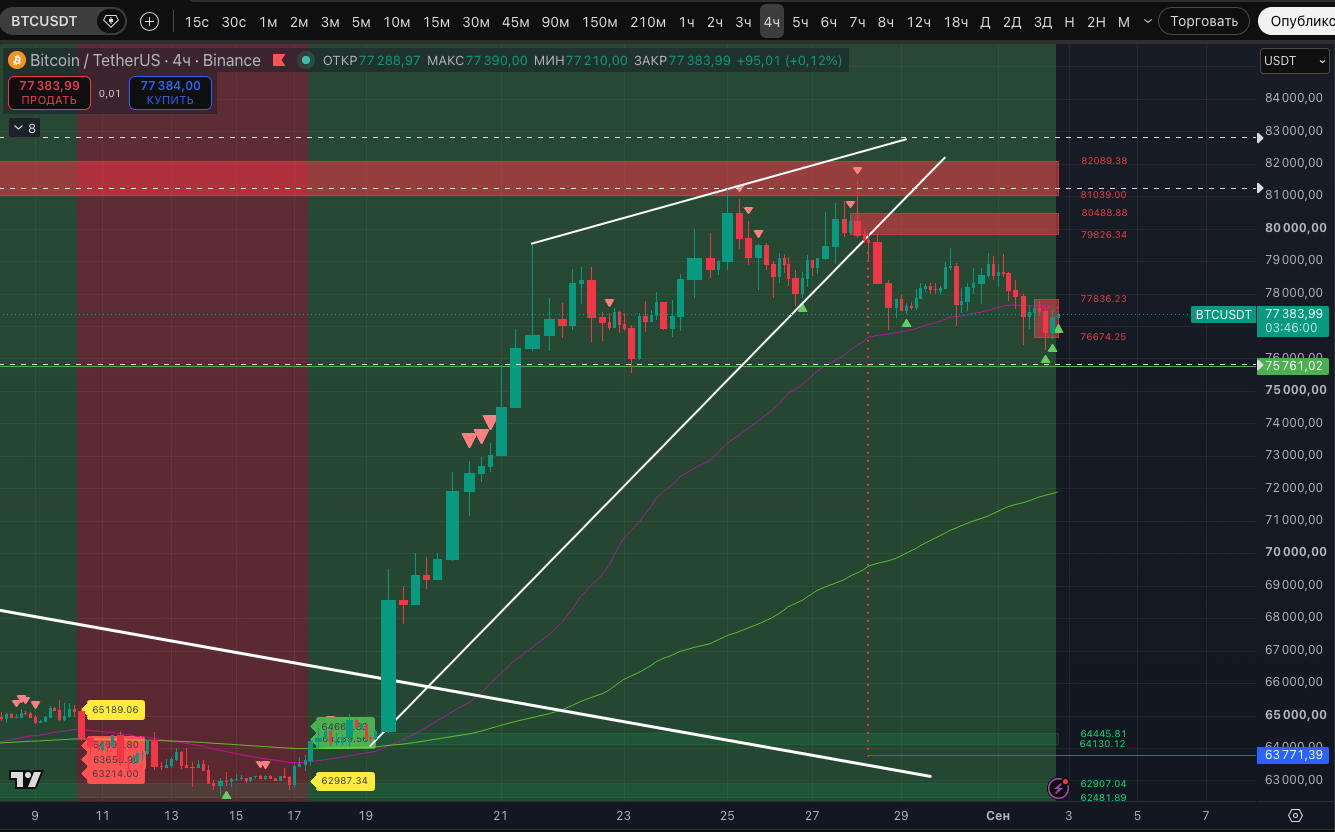
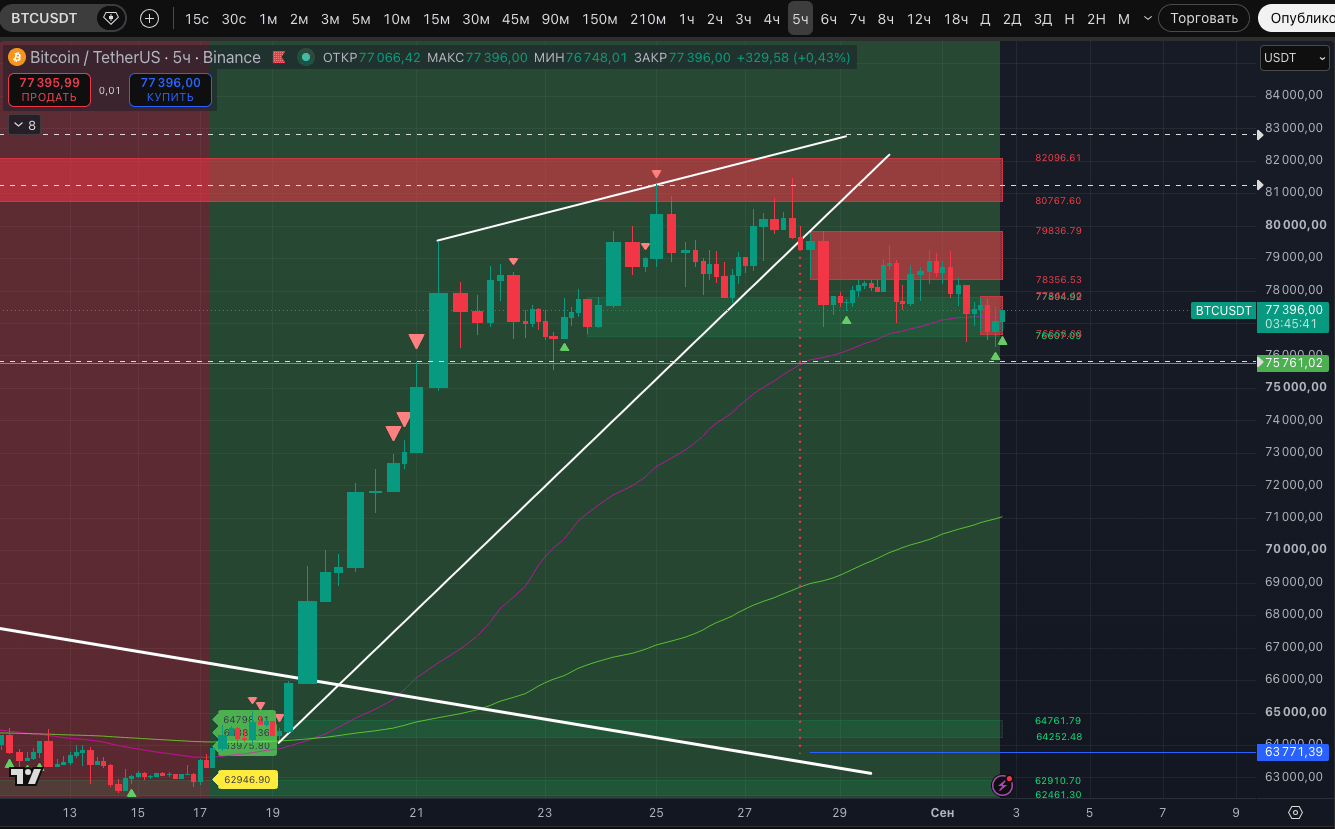
But for now, the situation overall still looks like buyer weakness. It’s unlikely we’ll see the jokey pattern "Bart Simpson" play out with a complete and rapid absorption of the August pump. But at least partially those green candles should have been covered by the sellers.