Everyone is watching $BNB /USDT for a breakout, but the data is whispering a different trade entirely.
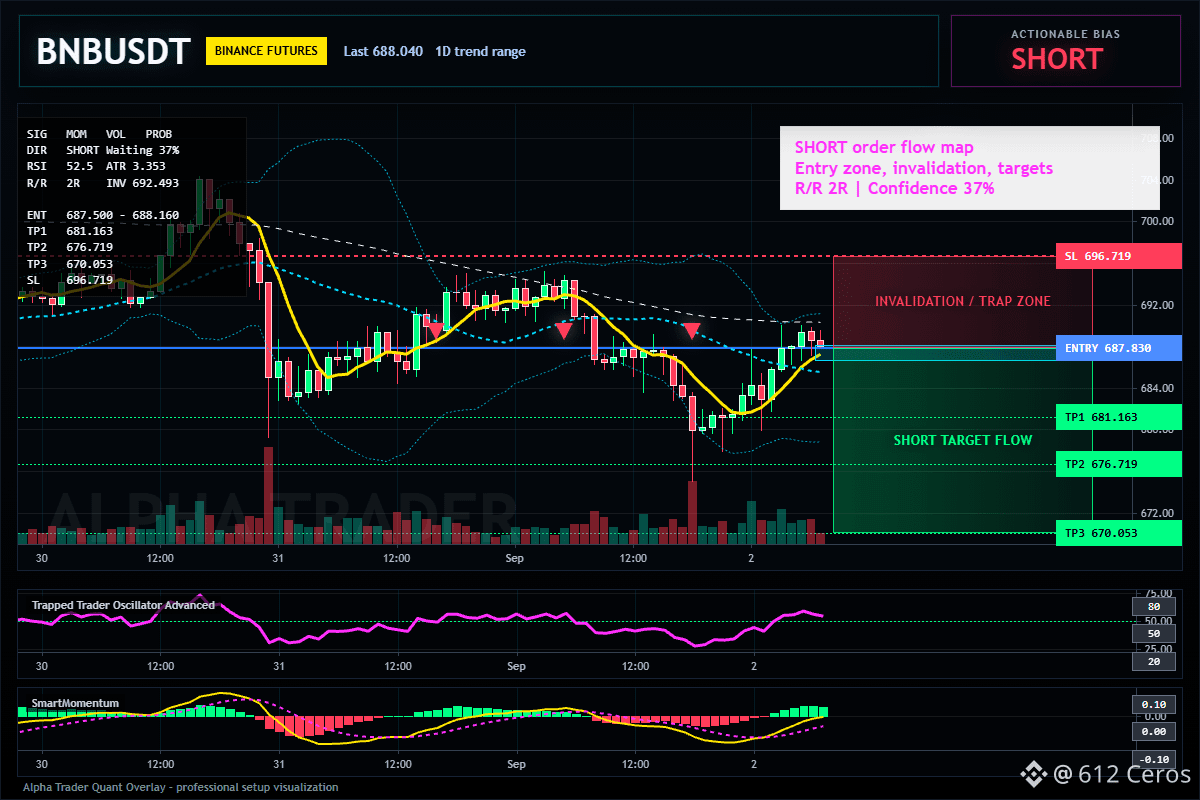
$BNB - 🔴 SHORT · Conf 37%
⚠️ Counter-trend setup — against the higher-timeframe trend (confirmed by 0 signals only). Higher risk, size down and respect the SL.
Trade Plan:
Entry: 687.500 – 688.160
SL: 696.719
TP1: 681.163
TP2: 676.719
TP3: 670.053
Why this setup?
Why now? The 4-hour momentum is stalling, and my model flags a SHORT setup at 687.830, but here is the catch: this is a counter-trend bet against the 1D range. Do not mistake this for a high-probability trend trade.
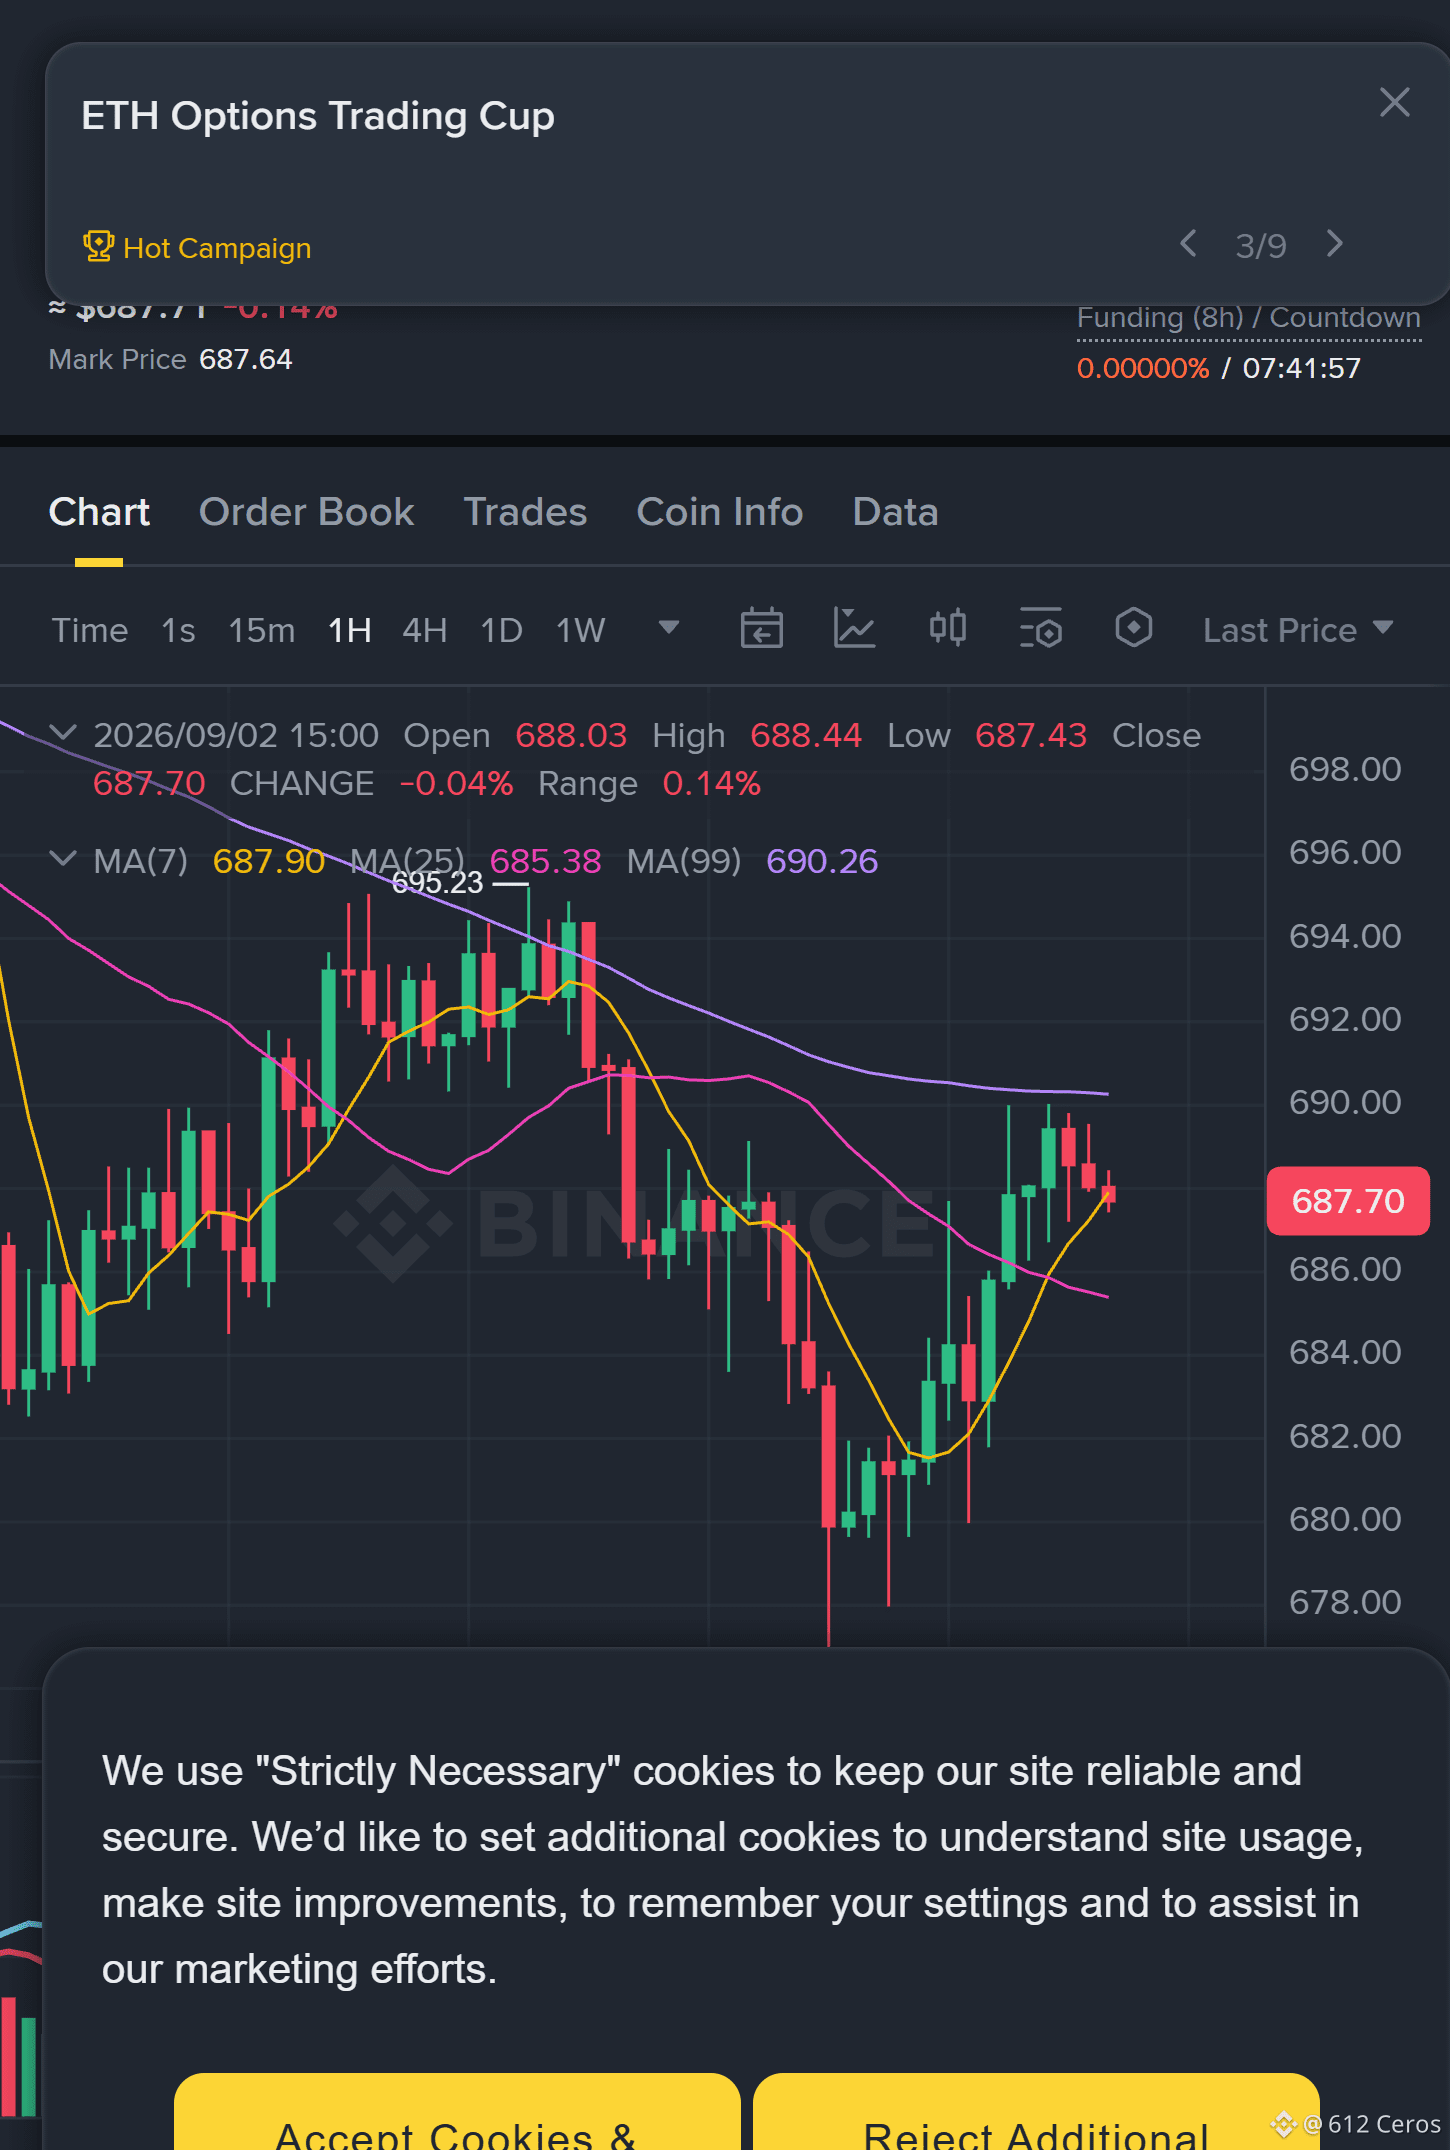
- The RSI on the 15m sits at 52.46, showing zero directional conviction right as price touches the upper bounds of the daily range.
- With the ATR at 3.35 on the 1h, we have enough volatility to reach TP1 at 681.163, but not enough to guarantee a clean sweep lower.
- The math is ugly: Confidence is only 37.1%, and there are 0 confirmed signals backing this move. You are fighting the bigger picture, not joining it.
- This is a REVERSAL bet against the higher-timeframe trend. Higher risk than a trend-following setup. If you take this, you MUST size down aggressively and respect the invalidation at 692.493. The stop at 696.719 is non-negotiable if you play this.
The edge here is razor-thin. If we lose 692.493, the short thesis is dead, and the alt target towards 694.497 becomes the path of least resistance.
Debate:
Are we fading this range high into 681, or is this the trap that sends us to 694 first?
Click here to view the chart 👇️
⚠️ Personal market analysis only. NFA — manage risk and DYOR.
Educational content, not investment advice or a recommendation to buy, sell, deposit, or withdraw any asset. No paid promotion or referral/affiliate links.
$BNB - 🔴 SHORT · Conf 37%
⚠️ Counter-trend setup — against the higher-timeframe trend (confirmed by 0 signals only). Higher risk, size down and respect the SL.
Trade Plan:
Entry: 687.500 – 688.160
SL: 696.719
TP1: 681.163
TP2: 676.719
TP3: 670.053
Why this setup?
Why now? The 4-hour momentum is stalling, and my model flags a SHORT setup at 687.830, but here is the catch: this is a counter-trend bet against the 1D range. Do not mistake this for a high-probability trend trade.
- The RSI on the 15m sits at 52.46, showing zero directional conviction right as price touches the upper bounds of the daily range.
- With the ATR at 3.35 on the 1h, we have enough volatility to reach TP1 at 681.163, but not enough to guarantee a clean sweep lower.
- The math is ugly: Confidence is only 37.1%, and there are 0 confirmed signals backing this move. You are fighting the bigger picture, not joining it.
- This is a REVERSAL bet against the higher-timeframe trend. Higher risk than a trend-following setup. If you take this, you MUST size down aggressively and respect the invalidation at 692.493. The stop at 696.719 is non-negotiable if you play this.
The edge here is razor-thin. If we lose 692.493, the short thesis is dead, and the alt target towards 694.497 becomes the path of least resistance.
Debate:
Are we fading this range high into 681, or is this the trap that sends us to 694 first?
Click here to view the chart 👇️
⚠️ Personal market analysis only. NFA — manage risk and DYOR.
Educational content, not investment advice or a recommendation to buy, sell, deposit, or withdraw any asset. No paid promotion or referral/affiliate links.