

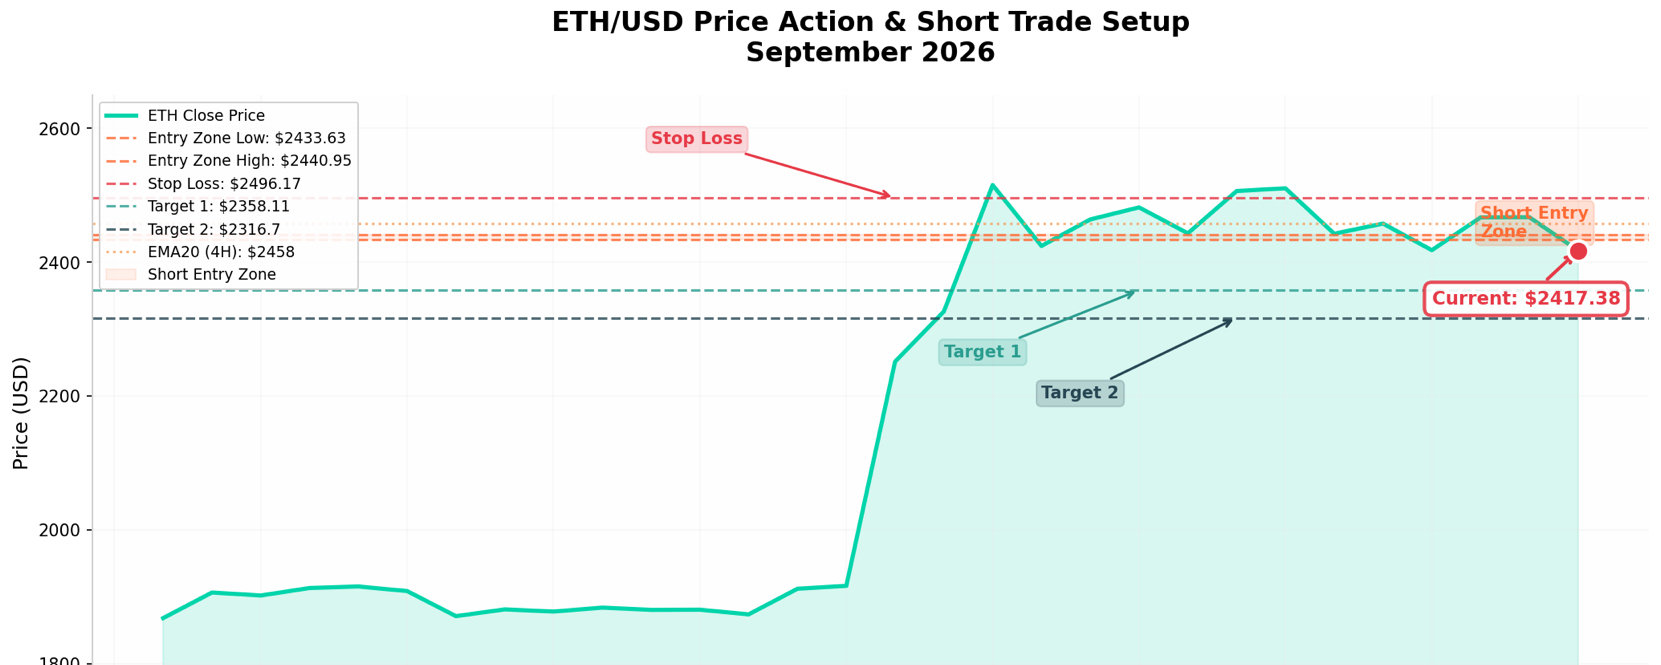

In early September 2026, ETH traded under pressure around $2,417. The 1-hour MACD short histogram continued to expand, and the 4-hour death cross was confirmed. Coupled with the macro backdrop of the Federal Reserve maintaining high interest rates and ongoing capital rotating out of the crypto market into the AI sector, the short-term bearish setup is clear and actionable. This article systematically breaks down current ETH short opportunities from four dimensions: technical indicators, order-book microstructure, macro liquidity, and trade execution. It also provides a complete risk-management plan including precise entry zones, dynamic stop-loss levels, and staged take-profit targets.
1. Current market positioning: the bearish path is not finished—short-term short window is now open
As of September 2, 2026, the ETH spot price is about $2,417, having pulled back roughly 37% from the year’s high. This drawdown is second only to SOL’s 40% and XRP’s 47% among the four major mainstream crypto assets; meanwhile Bitcoin during the same period is down only 29%, making it the best performer. Looking at a longer timeframe, after ETH hit a historical high of $5,413 in August 2025, it went through a deep adjustment lasting about 13 months. During this period there were several technical rebounds, but none managed to effectively break above key moving-average resistance; overall, the trend remains in a downward channel.
It’s worth noting that the current price is tightly hugging the 1-hour lower Bollinger Band (around $2,439), and the 4-hour EMA20 moving average is forming clear overhead pressure near $2,458. This means any rebound attempt to the upside will face dense technical resistance, while downside space under the backdrop of tightening macro liquidity has not yet been fully priced in.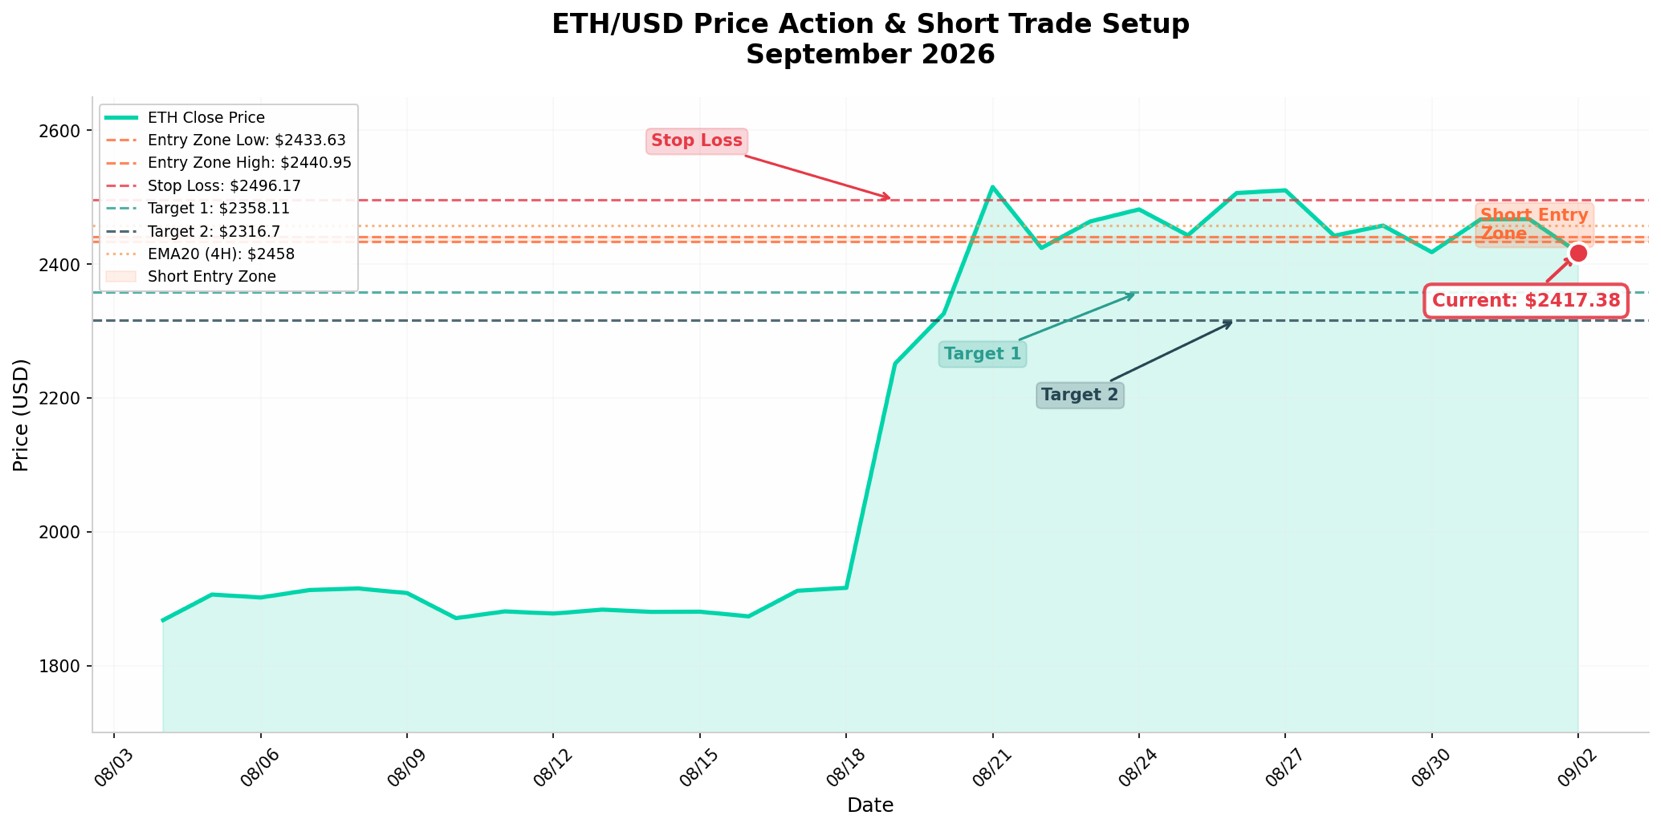
Section 2: Technical breakdown—bearish confluence across multiple timeframes
1. 1-hour MACD: bearish momentum accelerating its release
The 1-hour MACD histogram reading is -3.53 and shows a persistent expansion trend. The negative values magnifying indicate that bearish momentum is building up in the short term rather than fading. In trend trading, the directional continuation of the MACD histogram is often more useful than the golden-cross/death-cross signals themselves. When the histogram continues to lengthen below the zero line, it usually means the dominant funds are actively adding to the short direction rather than passively cutting losses.
2. 4-hour death cross: confirms the medium-term trend
The 4-hour level MACD has confirmed a death cross, which is a more reliable medium-term trend signal than the 1-hour level. Combined with the fact that price is trading below the EMA20 ($2,458), it suggests that any short-term rebound should be viewed as a "correction within a bearish trend" rather than a "trend reversal." Until price can effectively stand above the EMA20, any bullish narrative should be treated with high caution.
Section 1: Bollinger Band structure—lower band pressure, opening downward
The price is running along the lower Bollinger Band, and the band’s opening is expanding downward, which is a typical bearish trend characteristic. In a strong bearish market, price often keeps falling along the lower band, and the mid-band (around $2,500) becomes the first major resistance for a rebound. The current price’s tight adherence to the lower band also suggests the market lacks effective buy-side support—bears fully control the pace.
4. RSI: weak but not oversold; downside still has room
1-hour RSI is around 40—situated in a weak zone but not yet reaching the traditional oversold threshold below 30. This means that from a momentum-indicator perspective, ETH still has room to probe lower on the short term, and there is no forced rebound pressure caused by indicator oversold conditions. For short traders, being "not oversold" is precisely a favorable condition for the trend to continue.
Section 3: Order-book microstructure—seller dominance, moderate long leverage
Buy-side depth imbalance and buy/sell ratio
Order-book data shows a buy-side depth imbalance of 5.58%, and the latest 1-hour buy/sell ratio is only 0.34—meaning sell-side power fully dominates the market. This reveals two key points: first, the spot market’s willingness to absorb is weak; when large orders are sold, there is insufficient matching buy demand to digest them. Second, market sentiment is pessimistic—active sell orders far exceed active buy orders. In a macro environment where liquidity is already somewhat tight, such a deep imbalance can be amplified into a catalyst for accelerated price declines.
Open interest (OI) and funding rates
Current OI (open interest) remains stable, and there is no sign of bears adding positions aggressively. This state actually reduces the risk of a "short squeeze"—when shorts are overly crowded, any unexpected positive catalyst can trigger a chain reaction of short covering. Meanwhile, steady OI indicates that the short positioning structure is relatively healthy, with no self-correction pressure caused by excessive speculation.
Funding rates remain at a low level of 0.0012%, suggesting that long leverage is not heavy. Low funding rates imply that longs have not borrowed large amounts to build leveraged positions, so during the downside there won’t be a large-scale liquidation stampede. This provides shorts with a more “clean” path to decline—price can drift lower naturally on spot selling pressure, rather than relying on a cascade effect from leverage liquidations.
Section 4: Macros environment—liquidity tightening and fund rotation
Fed policy: sustained high rates suppress risk assets
The Fed will keep its interest rate in the 3.50% to 3.75% range in 2026, and in the most recent FOMC meeting, three committee members even voted in favor of rate hikes. In such an environment where “risk-free” Treasury yields are so attractive, the appeal of crypto assets as high-risk speculative allocations is significantly weakened. Investors don’t need to bear the wild volatility of the crypto market to get nearly 4% in certainty returns—this fundamentally removes incremental capital from the crypto market.
Although the market widely expects the Fed to implement 2 to 3 rate cuts in 2026 (major institutions such as Goldman Sachs, Morgan Stanley, and Bank of America are all betting on 2 cuts), there is a transmission lag from rate cuts. Also, the September meeting has not yet been realized. Until expectations are actually priced in, the high-rate environment will continue to suppress risk assets such as ETH.
Fund rotation: from crypto into AI
The most notable capital flow feature in 2026 is funds migrating from the crypto market to the AI sector. Data shows that since April, US gold and Bitcoin ETF combined have seen cumulative net outflows of about $12 billion, while US semiconductor ETFs in the same period have recorded net inflows of over $20 billion. This “path switching” is not a typical risk-off behavior; it’s funds reallocating within high-volatility themes—from crypto to AI. This means that even if macro liquidity improves in the future, funds may not necessarily return to the crypto market. The structural pressure ETH faces may exceed predictions from traditional cycle frameworks.
Ongoing net outflows from Bitcoin ETFs and institutional behavior
In total, US spot Bitcoin ETFs recorded cumulative net outflows of about $4.83 billion in 2026, including $4.51 billion in net outflows in June alone—setting a historically worst record. As a bellwether for the crypto market, the continued “bleeding” of Bitcoin ETFs reflects institutions’ withdrawal of funds. ETH, as the second-largest crypto asset by market cap, is unlikely to break out into an independent trend against the backdrop of pressure on Bitcoin.
In addition, both Galaxy Research and CryptoQuant have placed Bitcoin’s cycle low between September and November 2026. If Bitcoin continues to search for a bottom during that period, downward pressure on ETH will be amplified further.
Regulatory updates: Russia’s crypto law takes effect
Russia plans to formally implement crypto market regulations on September 1, 2026, requiring market participants to complete license applications and operational adjustments during a transition period of nearly 10 months. While clearer regulatory frameworks are beneficial for healthy industry development in the long run, in the short term compliance costs and uncertainties may prompt some Russia-related funds to temporarily step aside and wait, adding additional pressure to market liquidity.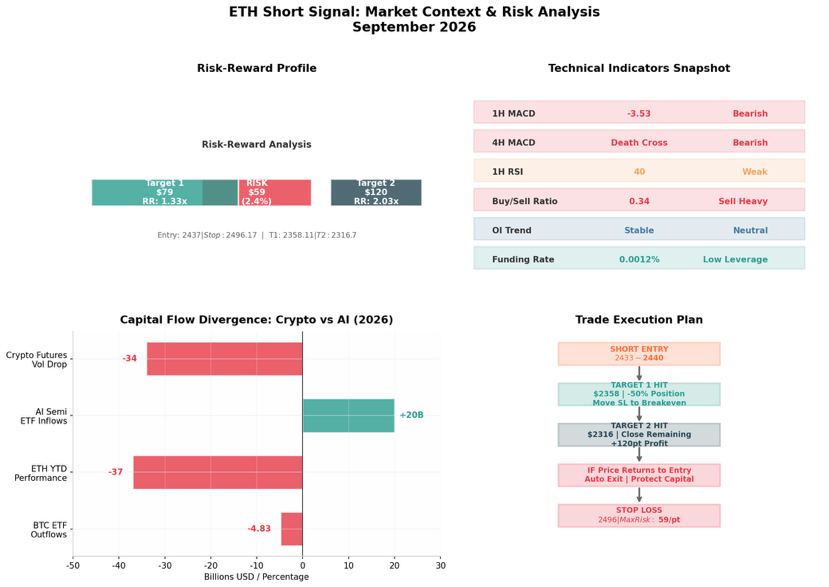
Section 5: Trading strategy—precise entry and dynamic risk control
Direction and entry
Direction: Short (sell/short)
Entry / pending order range: $2,433.63 – $2,440.95
The logic behind this range is based on three points. First, around $2,433 is a zone that has been tested multiple times recently, where short-term resistance has turned into support. If price rebounds to this level and meets rejection, it will form a high-probability short entry point. Second, around $2,440 is close to the overlap of the 1-hour Bollinger mid-band and the EMA20, forming a technical confluence resistance. Third, this range sits about $20–25 above the current price ($2,417), giving the market some room to rebound and reducing the slippage risk that comes with chasing shorts.
Stop-loss setup
Stop-loss level: $2,496.17
The stop-loss is set above $2,496, about $55 above the top of the entry range. This distance is enough to filter out everyday noise from fluctuations, while also ensuring that once the price effectively breaks above the $2,500 psychological level and the 4-hour EMA20 overhead resistance, the short thesis is invalidated and shorts can exit promptly. Using the midline of the entry range at $2,437, the maximum risk per trade is about $59 per ETH, with risk exposure controlled within 2.4%.
Target level and risk-reward
Target 1: $2,358.11 (risk-reward ratio ~1.34:1)
Target 2: $2,316.70 (risk-reward ratio ~2.03:1)
Target 1 is located near the area of dense trading at prior lows, making it the first support level most likely to be reached by short-term shorts. Target 2 corresponds to deeper support, requiring cooperation from the macro picture or the Bitcoin side to get there. The overall risk-reward design follows the principle of "small stop loss, big profit." Even if the 1.34 risk-reward for Target 1 looks modest, the expected value can still be positive under the premise of high-probability technical confluence.
Trade management: dynamic position reduction and a break-even mechanism
After reaching Target 1, execute a 50% position reduction, and move the stop-loss on the remaining position up to breakeven (the lower edge of the entry range). The core logic of this is: while locking in part of the profits, retain exposure to capture the larger gain at Target 2, and in the worst case the remaining position won’t be at a loss. If the price drops back into the entry range before touching Target, then exit automatically to protect principal from being eroded.
Section 6: Risk warnings and summary
Potential risks to watch include: first, if the Fed unexpectedly releases an overly dovish signal or cuts rates early, it could trigger a short-term rebound in risk assets; second, a major positive development at the Ethereum network level (e.g., the GlAmsterdam upgrade exceeding expectations) could change the short-term supply/demand structure; third, if Bitcoin finds a bottom and rebounds early in September, it could lead ETH to repair in sync.
However, looking at ETH from three dimensions—current technicals, order-book microstructure, and the macro environment—the bearish thesis at the beginning of September has high confidence. With 1-hour MACD expansion, 4-hour death-cross confirmation, seller-side dominance in the order book, stable OI with no squeeze risk, low funding rates, tightening macro liquidity, and continued capital flow to AI—these factors together paint a clear short-term bearish picture for ETH.
For traders, the key is not to predict where the bottom is, but to dare to hold positions along the trend when it’s clear, and to seek a reasonable risk-reward ratio with risk kept under control. The short window for ETH is already open; what remains is execution and discipline.
Disclaimer: This article is for market analysis and technical discussion only and does not constitute any investment advice. The crypto market is highly volatile and trading risk is extremely high. Please make an independent judgment based on your own risk tolerance. #ARB上涨30%受Robinhood链收入推动 #STRC优先股回购达6.35亿美元 #日本10年期国债收益率首触3% #WTI油价上涨未平仓合约收缩 #以太坊ETF连续11日净流入 $BTC


