



After Bitcoin’s (big BTC) price has risen for a while recently, have you noticed an interesting phenomenon:
The market didn’t seem to move much at all.
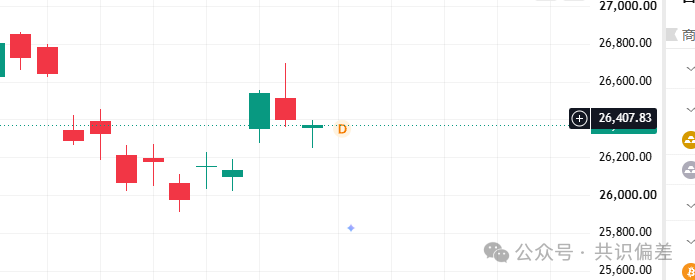
After the previous round of上涨, Bitcoin didn’t see a particularly big pullback, and it didn’t keep crazily surging either; instead, it moved into a fairly noticeable period of sideways consolidation.
Especially in the past few days, volatility has clearly declined.
Actually, this phenomenon isn’t surprising at all.
After a round of上涨, the market needs time to digest the profit-taking positions and re-trade/redistribute holdings, so sideways consolidation itself is completely normal.
But I think what’s even more worth paying attention to is:
Not only has BTC been going sideways; recently U.S. stocks have also entered a very clear low-volatility phase.
Let’s look at how U.S. stocks have been performing recently.
August 18: -1.3%
August 19: +0.6%
August 20: -1%
August 21: +0.43%
August 24: -0.76%
August 25: +0.66%
August 26: -0.08%
August 27: +1.57%
August 28: -0.52%
August 31: -0.12%
You can see a very clear characteristic:
Apart from two days—August 18 and August 27—when volatility moved by more than 1%, the rest of the time it’s basically been small gains and small dips.
That is to say, over the past two weeks, U.S. stocks have actually entered a very typical low-volatility range.
If you look at the Nasdaq, recently it has basically just been oscillating within a range.
This actually has to do with what stage the market is in.
After July 30, U.S. stocks went through a streak of consecutive gains that lasted for several days.
In mid-to-late August, as a large number of listed companies finish releasing their earnings reports, the market lacks new earnings catalysts, so capital naturally drifts into a waiting mode.
So low volatility in itself doesn’t necessarily mean the market is bearish.
In many cases, it instead means:
Both bulls and bears are waiting for a new variable.
And here’s the most thought-provoking question in my view:
So what exactly will this variable be next?
I’ve been thinking: is there a macro factor strong enough right now to cause U.S. stocks to fall into a sustained downtrend?
So far, it’s not particularly obvious.
War?
Right now, geopolitical risks still exist, but the market’s sensitivity to this kind of news has clearly declined.
The Fed?
That’s actually the biggest variable right now.
Especially recently, there has been heavy interpretation of Fed Chair Waller’s remarks. Many media outlets even directly label it a “hawkish shift,” suggesting that September could see another rate hike.
This is indeed one of the biggest potential risks in the market right now.
But personally, I think it’s still too early to directly conclude that “the Fed will definitely raise rates.”
Because the core meaning of “volatility compression” is actually:
If inflation does not continue to move toward 2% as expected, then the Fed will need to further tighten policy.
That is to say, whether or not to raise rates ultimately depends on the inflation and employment data to come.
Market expectations for September rate hikes have indeed clearly risen, but inside Wall Street there is still disagreement. Some institutions think September may hold steady; the real key is actually the CPI, PCE, and employment data to be released next.
So in my view:
The Fed is a risk, but right now it still can’t be directly defined as a certain big negative catalyst.
On the other hand, from the perspective of fundamentals and technicals, U.S. stocks currently also haven’t shown any particularly clear “collapse” signals.
Even from a technical structure perspective, the index is still in a relatively strong position.
That’s also why I’m still more inclined to:
Continue upward after going sideways, rather than immediately turning into a bear market.
Of course, there’s a very important prerequisite here:
The longer it goes sideways, it doesn’t necessarily mean it will rise higher.
“The longer it goes sideways, the higher it goes vertically” is just market experience—not a hard rule.
What really matters is:
During the sideways period, has there been a clear withdrawal of funds and a break of the trend?
If not, then low volatility may actually be building up for the next burst of volatility.
And once a new catalyst appears, volatility could suddenly expand again.
There’s another very interesting factor—time.
September, historically, is usually a relatively weak month for U.S. stocks.
Based on long-term historical data, September is indeed one of the S&P 500’s weakest months on average—possibly even the only month where the long-term average return is clearly negative.
So going forward, the market may end up in a very interesting state instead:
Fundamentals haven’t clearly deteriorated, but because of the “September effect,” the market is naturally more cautious.
Capital isn’t willing to chase higher prices, and the bears don’t have enough reason to massively short.
And that leads to:
Volatility falls → capital waits on the sidelines → the market goes sideways.
But if, by the end of September, there isn’t a clear macro negative shock, then in the fourth quarter the market’s trading logic may change again.
Because starting in October, a new earnings-report cycle will gradually kick back in.
And from a historical seasonal perspective, the fourth quarter overall is also a relatively strong period for U.S. stocks.
So I actually think:
September could be a fairly important period to “build up momentum.”
And this is also very important for Bitcoin.
Why?
Because the linkage between BTC and U.S. stocks is still very obvious right now.
Of course, this kind of correlation is never 100%.
For example, in the days when Bitcoin surged earlier, U.S. stocks even posted a small decline.
So it can’t simply be understood as:
U.S. stocks rise → BTC rises; U.S. stocks fall → BTC falls.
Bitcoin has its own capital, its own narrative, and its own market cycle.
But in most cases, the global risk-asset liquidity environment still influences BTC.
Here’s a very typical example recently.
When there’s no U.S. stock trading over the weekend, BTC trades out a fairly independent run—rising from around $77,000 all the way to about $79,000.
But when the market reopened on Monday, U.S. stocks saw a pullback, and BTC quickly returned to roughly where it was before.
This implies:
BTC can temporarily trade independently of U.S. stocks, but it’s hard to remain completely detached long term from the global risk-asset liquidity environment.
So what I’m most focused on right now actually isn’t whether BTC is up or down today.
Instead, it’s:
How long can U.S. stocks keep going sideways?
And also:
How long can Bitcoin keep going sideways?
Because both markets are currently in a very similar state:
After the rally, volatility declines, the price goes sideways, market sentiment shows no obvious FOMO, and there’s no panic.
This kind of phase is often the easiest for people to lose patience.
But from a trading perspective, what’s really worth paying attention to is exactly this kind of “boring” phase.
Because the market won’t go sideways forever.
Volatility can compress, but it won’t disappear forever.
Once new macro data, earnings reports, rate expectations, or liquidity changes show up, the market will ultimately choose a direction.
If U.S. stocks can withstand seasonal pressure in September and there isn’t a clearly large drawdown, then after entering the fourth quarter, I’d actually focus even more on a fresh risk-asset rally.
And if U.S. stocks break upward again, then for the BTC—already having completed a round of gains and currently consolidating sideways:
It’s very likely to be a catalyst for the second acceleration.
So for now, I’m still leaning bullish.
It’s not because I think the market is guaranteed to rise, but because:
So far, there hasn’t been enough strong reason for this uptrend to end directly.
What you really need to be wary of is whether the Fed, the inflation data, and U.S. stocks can hold on to the current trend.
If these risks can be digested by the market, then this sideways action right now may not mean the end of the trend.
Instead, it’s setting up the next leg of the rally:
Building momentum. $BTC
