《Precautions and Trading Tips for Following-Trend and Reversal Analysis》
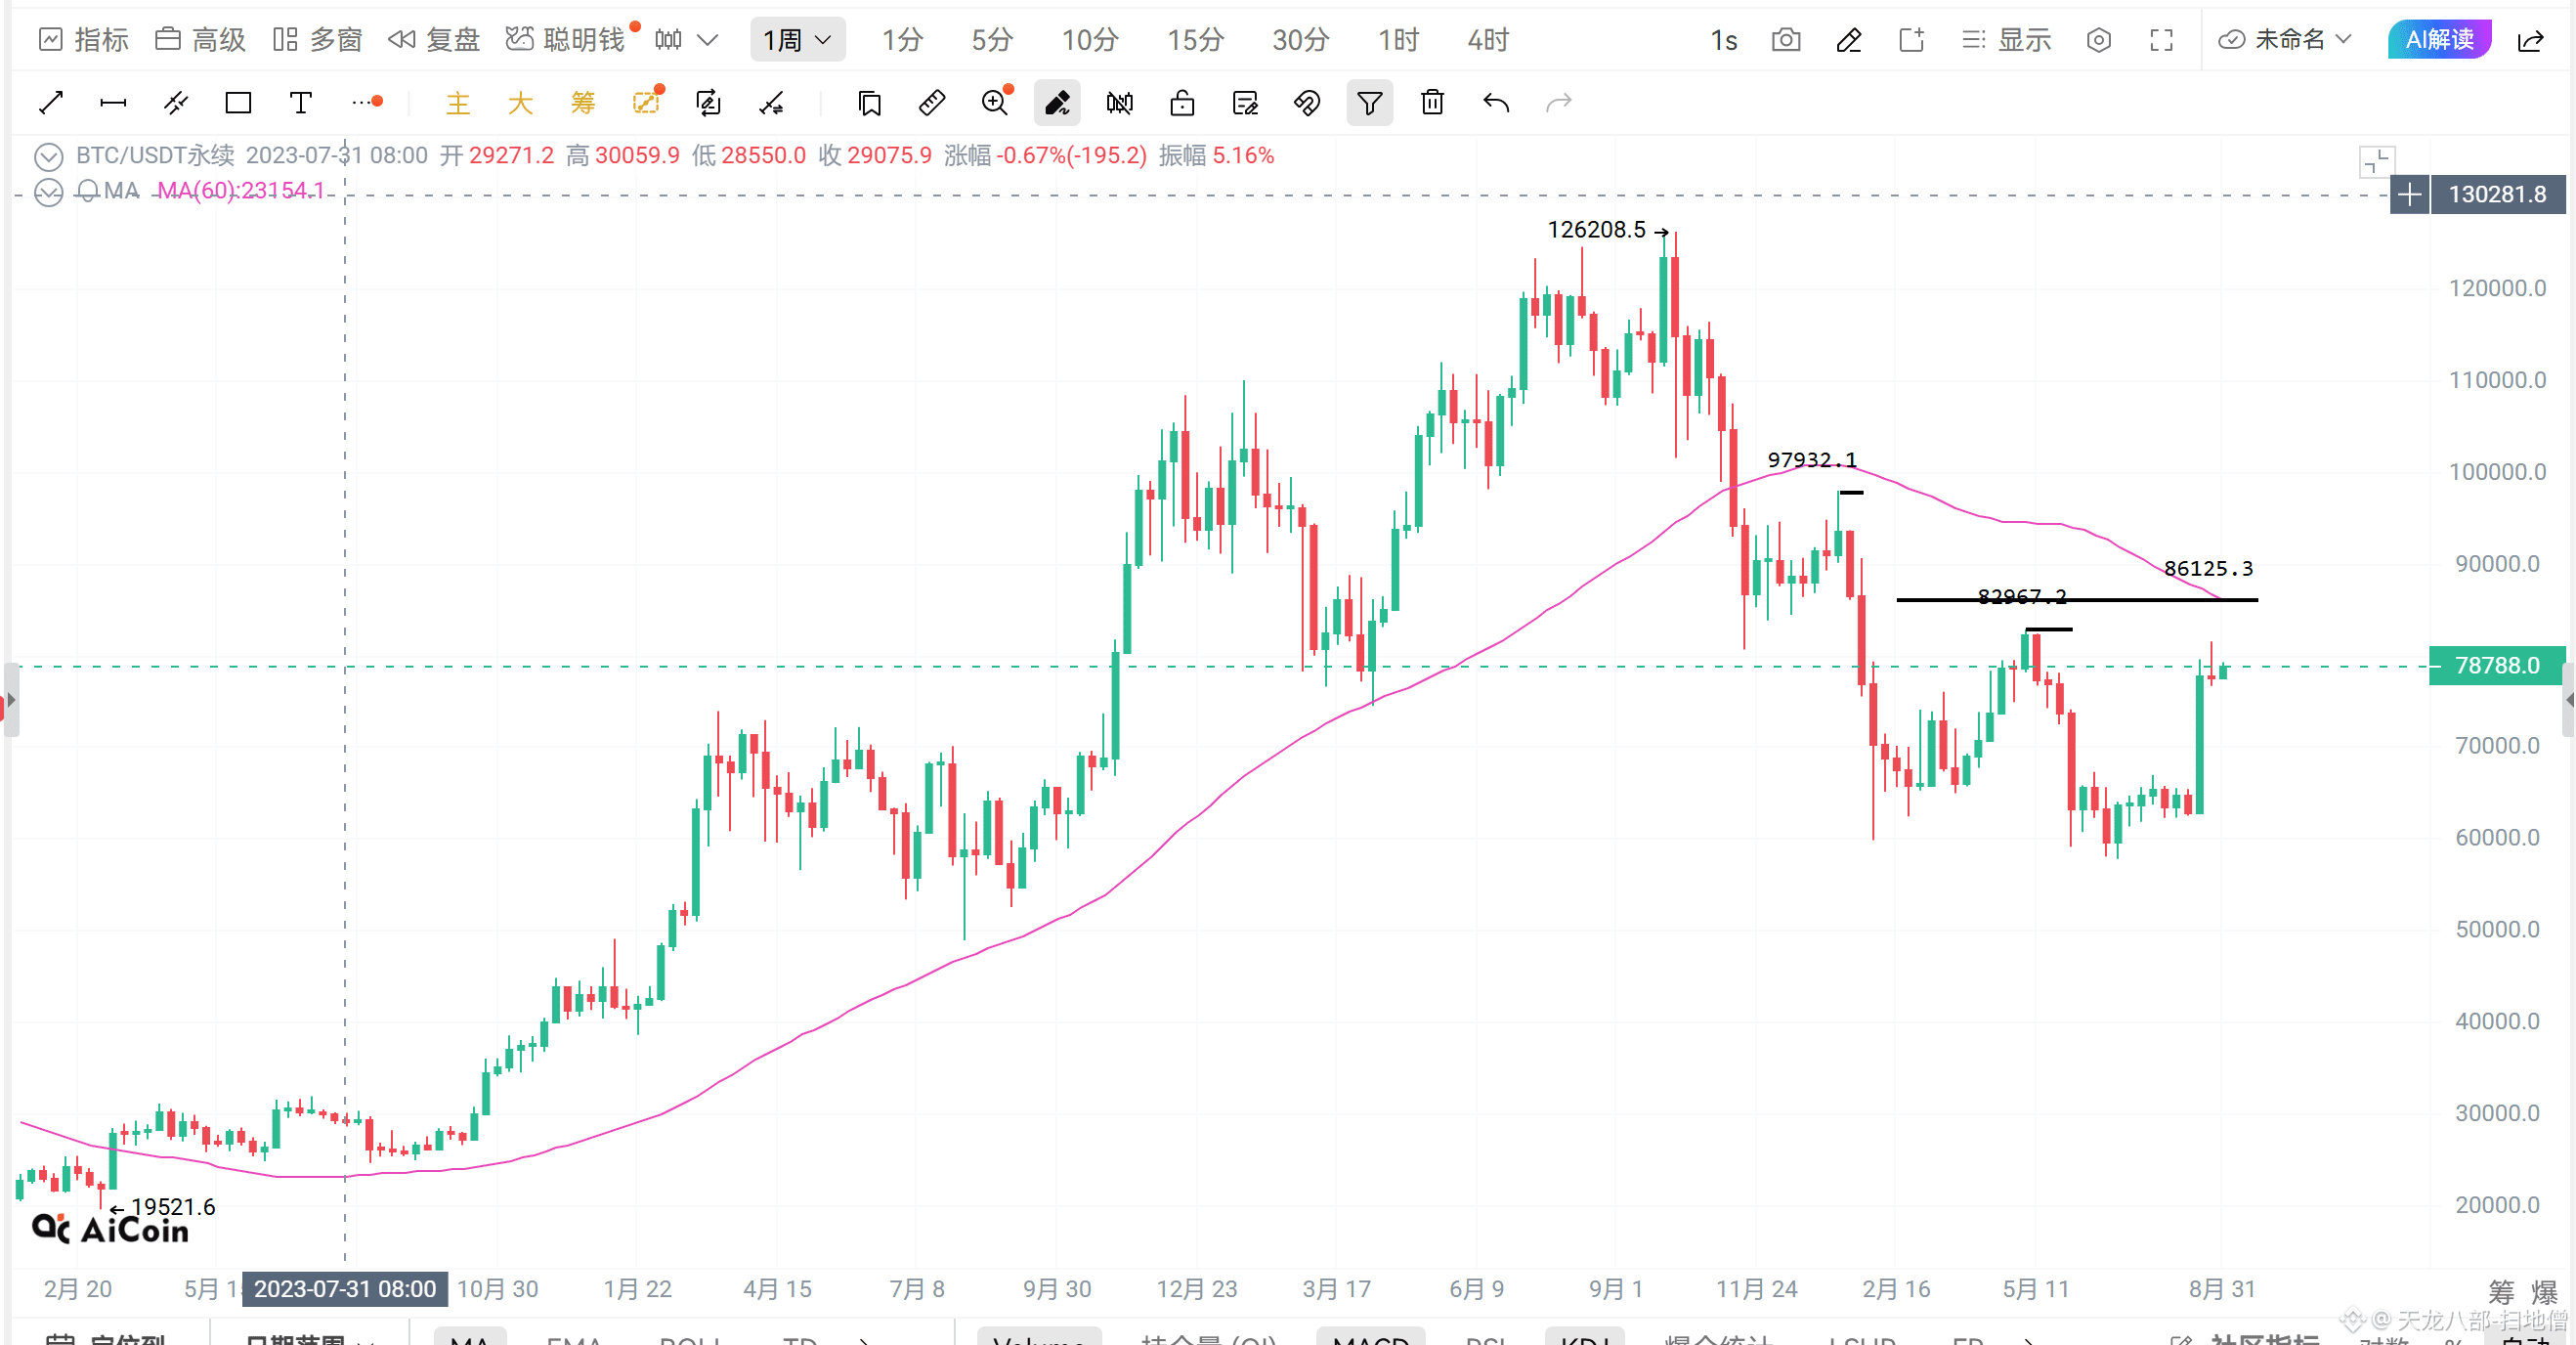
126000 98000 83000. Last time, price moved downward from the high because the monthly chart indicators were bearish. As long as the weekly chart analysis shows price is in the sell-off zone, you can open short positions in batches. That is following-trend analysis: enter shorts in batches within the sell-off zone to avoid missing the larger downward trend.
Now the monthly chart indicators are bullish, and the weekly chart analysis may enter a sell-off phase at any time. However, you cannot open shorts in batches in advance, because the overall direction is bullish. Only if the market has already reached the extreme high area—around 86000—and the weekly chart indicators have formed a downward trend, then you can short. Otherwise, you can’t open shorts in batches early. Even if the weekly chart forms a bearish trend, and the market goes against the larger uptrend, it would be just a simple pullback and would not break below the foundation level at 58000. Most likely, support will form around 75000 69000. It could even push higher to the strong resistance around 86000, then reverse into a downward pullback, and form another support bounce point around 80000.
So, when the weekly-level pullback and downtrend actually begin determines where the support-and-bounce points are. This is reversal analysis—there is no “sell-off zone.”
So the current market is suitable for swing trading. Also, the current medium-term indicators and the 1-hour indicators are in the early bullish stage, so it’s easy for another big breakout move to happen. For now, let’s wait and see at the extreme level—look below 86000 first. For now, it’s still mainly swing trading.
For example, when I went live last night, since I’d taken a week off, I tried calling some long trades. The long at 78140 had a stop-loss at 77500. This morning, after checking the high around 79200, price fell back to around 78200. Now it’s come back to the vicinity of 79200. This is a typical swing-trading market. But as it stands now, with the 1-hour and mid-range indicators bullish, and with the resistance level at 80000, watch what happens next.
Swing trading also has its own requirements. For instance, if yesterday into today saw a ranging market: after a pullback to the lower range and then moving back up, and with both the 1-hour and mid-term indicators bullish—for example, a long near 78200—you can switch the stop-loss to breakeven and just hold for the bullish continuation. Don’t obsess over the small swing profit; take profits and still look higher. As for the weekly indicators, they’re not at a bearish stage yet. The monthly indicators are bullish, so there is still room upward. First, see what happens around 80000 before deciding. This is typical “trade with the trend,” using swing profits to probe for more upside. Even if you set it to breakeven, it doesn’t harm your principal.
$BTC
126000 98000 83000. Last time, price moved downward from the high because the monthly chart indicators were bearish. As long as the weekly chart analysis shows price is in the sell-off zone, you can open short positions in batches. That is following-trend analysis: enter shorts in batches within the sell-off zone to avoid missing the larger downward trend.
Now the monthly chart indicators are bullish, and the weekly chart analysis may enter a sell-off phase at any time. However, you cannot open shorts in batches in advance, because the overall direction is bullish. Only if the market has already reached the extreme high area—around 86000—and the weekly chart indicators have formed a downward trend, then you can short. Otherwise, you can’t open shorts in batches early. Even if the weekly chart forms a bearish trend, and the market goes against the larger uptrend, it would be just a simple pullback and would not break below the foundation level at 58000. Most likely, support will form around 75000 69000. It could even push higher to the strong resistance around 86000, then reverse into a downward pullback, and form another support bounce point around 80000.
So, when the weekly-level pullback and downtrend actually begin determines where the support-and-bounce points are. This is reversal analysis—there is no “sell-off zone.”
So the current market is suitable for swing trading. Also, the current medium-term indicators and the 1-hour indicators are in the early bullish stage, so it’s easy for another big breakout move to happen. For now, let’s wait and see at the extreme level—look below 86000 first. For now, it’s still mainly swing trading.
For example, when I went live last night, since I’d taken a week off, I tried calling some long trades. The long at 78140 had a stop-loss at 77500. This morning, after checking the high around 79200, price fell back to around 78200. Now it’s come back to the vicinity of 79200. This is a typical swing-trading market. But as it stands now, with the 1-hour and mid-range indicators bullish, and with the resistance level at 80000, watch what happens next.
Swing trading also has its own requirements. For instance, if yesterday into today saw a ranging market: after a pullback to the lower range and then moving back up, and with both the 1-hour and mid-term indicators bullish—for example, a long near 78200—you can switch the stop-loss to breakeven and just hold for the bullish continuation. Don’t obsess over the small swing profit; take profits and still look higher. As for the weekly indicators, they’re not at a bearish stage yet. The monthly indicators are bullish, so there is still room upward. First, see what happens around 80000 before deciding. This is typical “trade with the trend,” using swing profits to probe for more upside. Even if you set it to breakeven, it doesn’t harm your principal.
$BTC