


31/08/2026
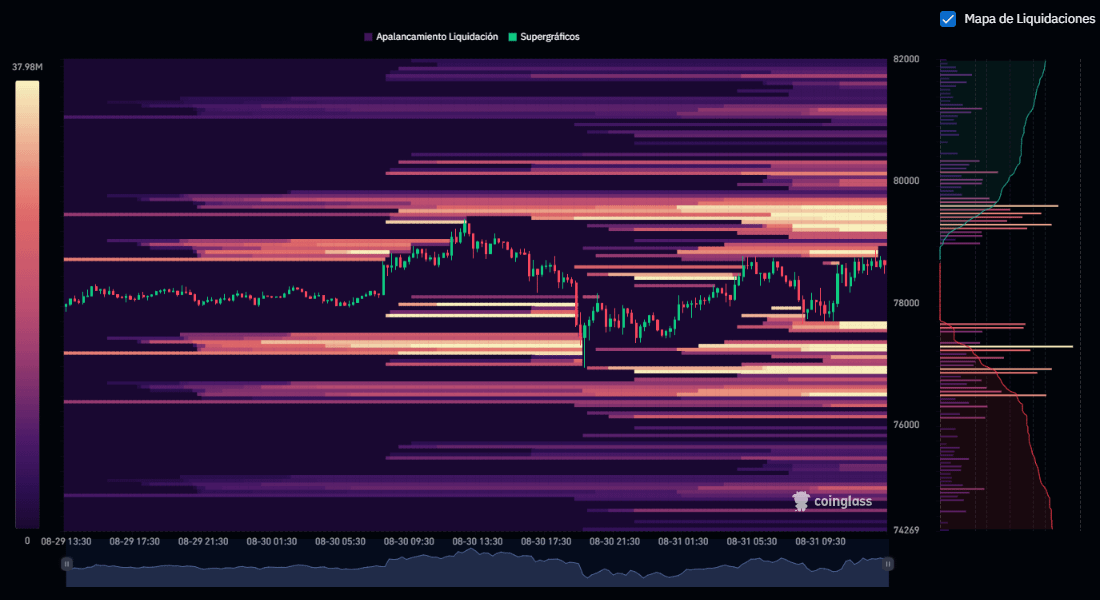
Liquidation heatmaps are lighting up all institutional alarms in Bitcoin (BTC/USDT). With the price trading in the key range of $78,580 USDT, the structure doesn’t show weakness—it shows a wall of accumulated liquidity acting like a true bullish magnet.
If you’re trading intraday or managing portfolios today, analyze your strategy to back up your capital and avoid liquidations. Remember we’re closing the month under geopolitical and macroeconomic pressure.
What do liquidity maps reveal?
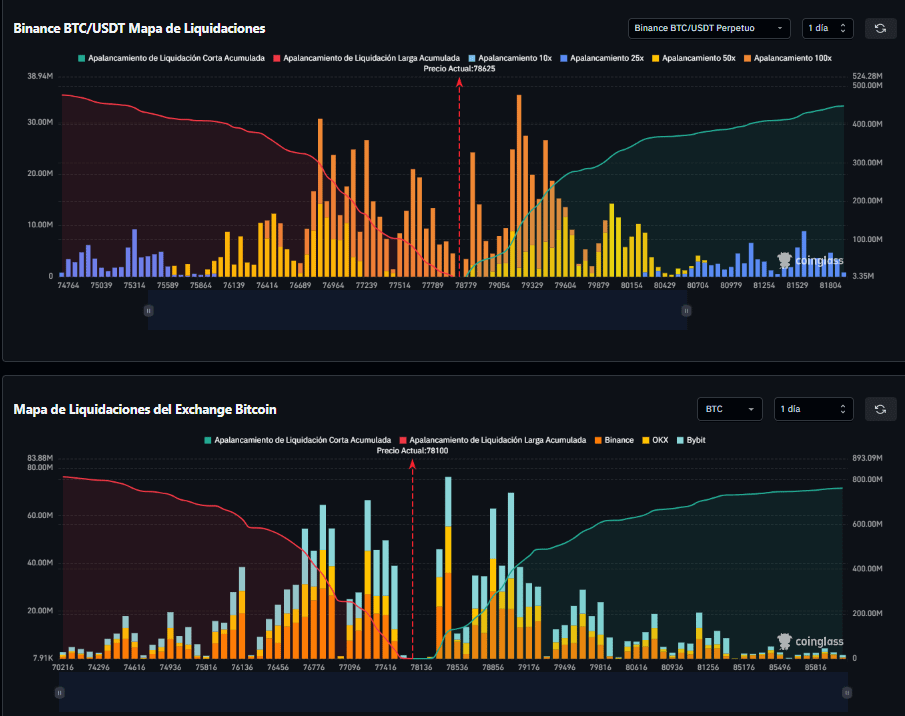
Depth analysis and liquidations reveal a massive imbalance in market positioning:
The upper hunt ($79,200 – $81,500): There is massive short leverage accumulation (shorts at 25x and 50x). Market Makers have a direct financial incentive to push the price and sweep those stop losses.
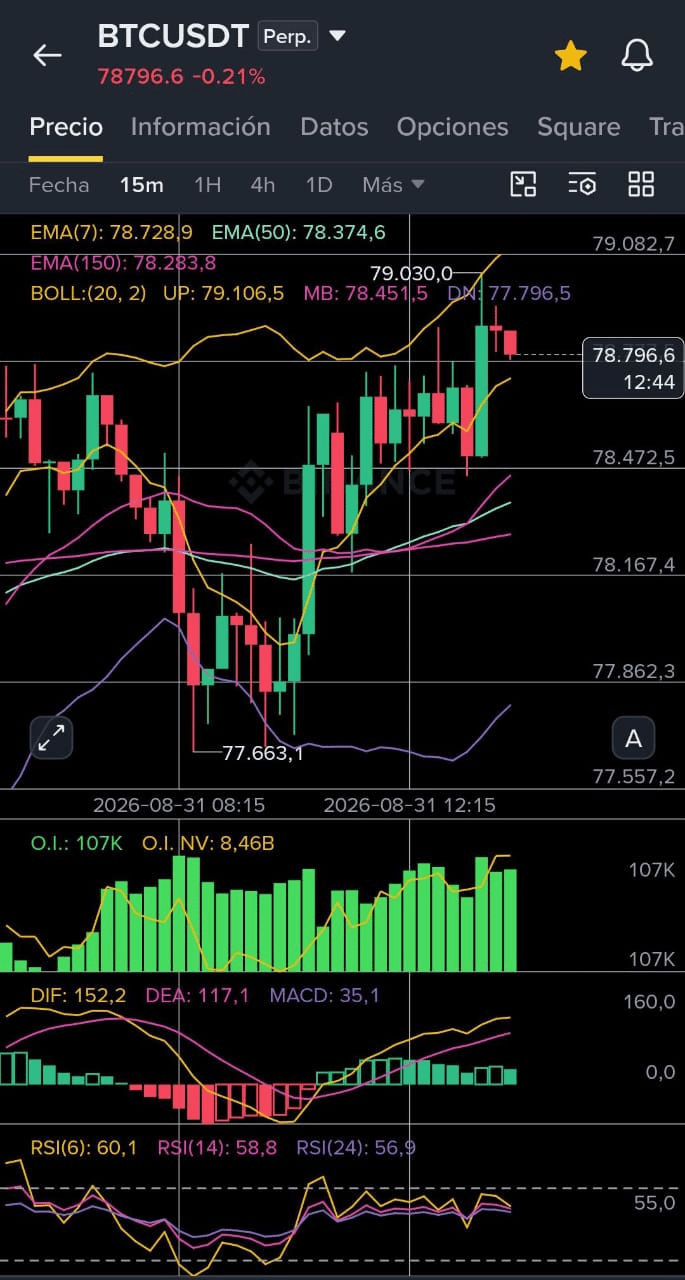
Defense of the floor ($77,000): The strong bullish rejection in the $77,000 area left a buy-side absorption wick on 15m and 1H timeframes, marking the invalidation of the prior bearish impulse.
The market is in a volatility compression phase. When the Bollinger Bands narrow in these high-liquidity zones, the resulting breakout is usually fast and unidirectional.
Fundamental and Geopolitical Analysis
The macroeconomic backdrop continues to support the underlying narrative for Bitcoin:
Federal Reserve (Fed) and the U.S. Government: The market is pricing in more expansive monetary policies or consolidated rate cuts that weaken the U.S. dollar index (DXY). The accumulation of U.S. debt and ongoing stimulus have reinforced BTC as the ultimate safe-haven asset against fiat devaluation. U.S. regulatory policies toward the crypto ecosystem have matured, allowing sustained injections of institutional capital (ETFs and corporate reserves).
Geopolitics: Global economic fragmentation and commercial/strategic tensions between powers keep uncertainty at a high level. Global institutional and retail investors are using Bitcoin as an uncapturable hedge against local currency instability and cross-border financial blocks.
Roadmap for Day Trading: Two Trades
🔸 Option A: LONG STRATEGY (Taking advantage of the Short Squeeze)
Entry Point: Confirmed retest in the $78,350 - $78,500 zone or breakout with volume above $78,850.
Take Profit 1 (TP1): $79,300 (Take partials in the first wave of liquidations)
Take Profit 2 (TP2): $80,100 (Psychological level and core of the heatmap)
Take Profit 3 (TP3): $81,400 (Explosion up to the previous high)
Stop Loss (SL): $77,500 (Below the structural support)
🔸 Option B: SHORT STRATEGY (Swing Failure Pattern at Resistance)
Entry Point: Trigger only after seeing a sweep in $79,800 - $80,200 followed by immediate rejection (candle with a long upper wick and RSI overbought).
Take Profit 1 (TP1): $78,800
Take Profit 2 (TP2): $77,800
Take Profit 3 (TP3): $76,800
Stop Loss (SL): $80,800 (Above the sweep peak)
⚠️ This is not financial advice, do your own analysis (DYOR).
Open Debate for the Community:
The liquidation map indicates that the move toward $80,000 is the path of least resistance, but in trading risk management is everything.
👉 What’s your stance for the next few hours?
A) We break $80K today with a violent squeeze.
B) We test the $75K area again before the real breakout.
Leave your analysis in the comments, hit Like 👍SHARE 🔁 so it reaches more people on the platform.
🔥 I invite you to our public group:
Trading’s fantastic people! 🔥🚀💵
May the power of the trend be with you! 🔥💚🦁🔥
#bitcoin #Binance #BTC #losfantasticosdeltrading #nuricrypto
$BTC Operate here ⬇️⬇️⬇️


