The engine writes the main count as a push wave running upward with the current. The endpoint of that wave set is 65026. The current price is 77742. That extra 12,000 in the middle—do you read it by the old 5-wave extension, or by the new swing count after Aug 19?
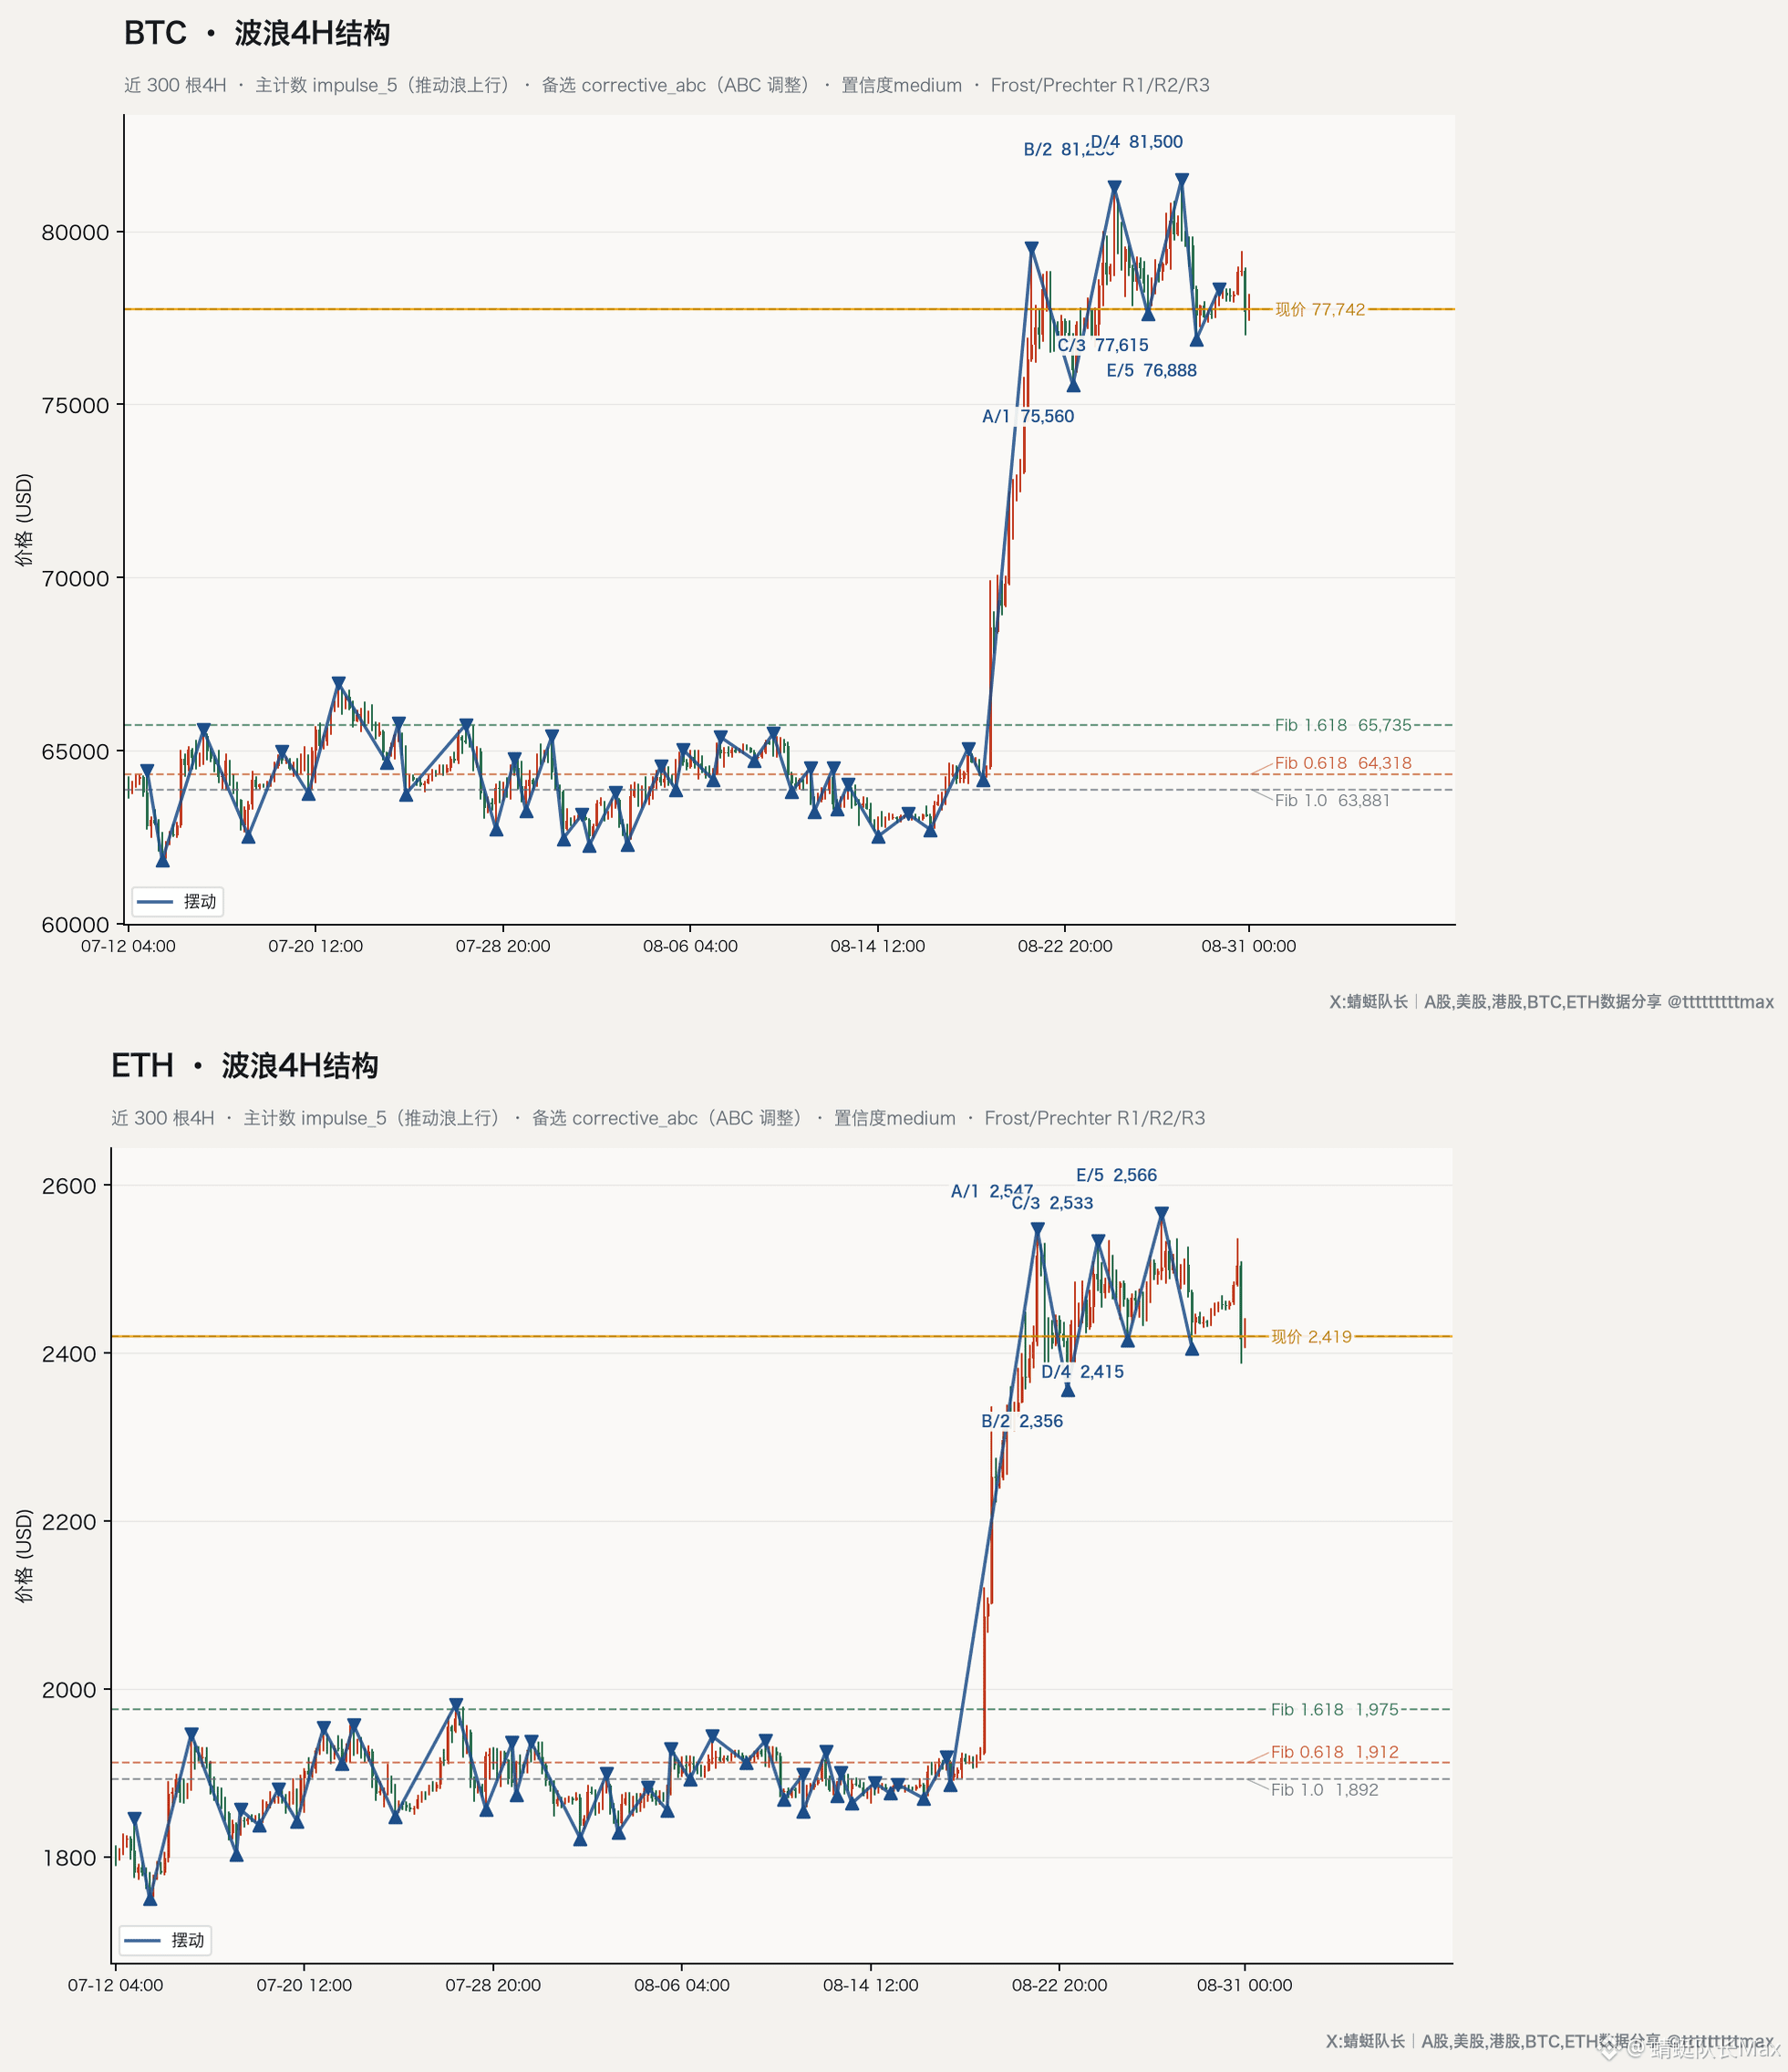
For the structure diagram, see the cover. Top half: BTC. Bottom half: ETH. Data uses the most recent 300 4H candles. Engine: elliott-r123-v2. Hard rules follow Frost and Prechter’s R1, R2, R3. The latest candle opened at 00:00 UTC on Aug 31; at the time of writing it has not closed. The current price is a closing snapshot of that ongoing candle.
【Where the engine’s main count stops】
BTC main count is impulse_5; it passes R1, R2, and R3. Confidence: medium. All six wave points fall between Aug 1 and Aug 5. Start: 62268.5. End: 65026.6. Wave lengths: wave 1 ≈ 1530.8, wave 3 ≈ 2242.7, wave 5 ≈ 1145.9.
ETH is also impulse_5; it passes all three hard rules as well. Wave points fall between Aug 3 and Aug 7. Start: 1828.81. End: 1943.60. Wave lengths: wave 1 ≈ 53.43, wave 3 ≈ 72.7, wave 5 ≈ 51.18.
The engine’s Fib is also attached to this old wave set. BTC’s 0.618 is at 64318; ETH’s 0.618 is at 1912. The dashed line on the right describes the window completed in early August—not the money around the 77k area right now.
【The nearby swing only hugs the current price】
After Aug 19, both sides moved away from the old endpoints. BTC pulled from 64163.6 to 81499.9, then back to 76888; on Aug 29 it snapped back to 78336.6. Current price at the time of writing: 77741.8; this candle’s high is 78183.4 and low is 77428.5.
ETH pulled from 1885.84 to 2566.46, then received 2405.83 on Aug 28. Current price at the time of writing: 2419.08; this candle’s low is 2406.97, and price is still pressing around that low.
The alternative ABC lands in the last few days. BTC’s four points are 77615.1, 81499.9, 76888, 78336.6. ETH is 2533.33, 2414.92, 2566.46, 2405.83. The score is only 2, for comparison only.
The nearby guide levels are calculated separately. BTC from 75559.5 to 81499.9: 0.618 ≈ 77829, and the current price sits just below it. A wider segment from 64163.6 to 81499.9: 0.382 ≈ 74877. ETH from 2356.19 to 2566.46: 0.618 ≈ 2437. From 1885.84 to 2566.46: 0.382 ≈ 2306.
【How to read the order book】
For the main count: once it’s through, it only means that the 5-wave set from early August has already finished. The nearby area has not yet had a new six-wave point that simultaneously passes all three hard rules, so the engine still keeps the old set as the primary position. When reading the current price, treat the main count as the backdrop, and the nearby highs/lows as the observation in progress. Use 4H closes—don’t read the intraday spikes.
BTC holds 76888, and you can treat this as consolidation in high territory. If consecutive 4H closes break below it, the next target is 75559; if that breaks, look at the comparison level 74877. For a rebound: first watch 78337, then 81499.9. As long as the prior highs aren’t recovered, don’t treat the nearby area as a new complete impulsive wave.
ETH first watches 2405. If it holds, then look above at 2437, and then 2566. If it closes below 2405, the next target is 2356; only after that breaks does 2306 become a real discussion.
【The real question】
Do you treat 77742 as the 0.618 pullback of the move from 75559 to 81499, or as the midpoint of the new ABC? For BTC or ETH, report your invalidation level.
$BTC $ETH #波浪理论 #BTC #ETH
Captain Dragonfly|A finance blogger who likes analyzing data and candlestick charts.
Not investment advice. Wave counting and water-level observations are only for structural comparison.
For the structure diagram, see the cover. Top half: BTC. Bottom half: ETH. Data uses the most recent 300 4H candles. Engine: elliott-r123-v2. Hard rules follow Frost and Prechter’s R1, R2, R3. The latest candle opened at 00:00 UTC on Aug 31; at the time of writing it has not closed. The current price is a closing snapshot of that ongoing candle.
【Where the engine’s main count stops】
BTC main count is impulse_5; it passes R1, R2, and R3. Confidence: medium. All six wave points fall between Aug 1 and Aug 5. Start: 62268.5. End: 65026.6. Wave lengths: wave 1 ≈ 1530.8, wave 3 ≈ 2242.7, wave 5 ≈ 1145.9.
ETH is also impulse_5; it passes all three hard rules as well. Wave points fall between Aug 3 and Aug 7. Start: 1828.81. End: 1943.60. Wave lengths: wave 1 ≈ 53.43, wave 3 ≈ 72.7, wave 5 ≈ 51.18.
The engine’s Fib is also attached to this old wave set. BTC’s 0.618 is at 64318; ETH’s 0.618 is at 1912. The dashed line on the right describes the window completed in early August—not the money around the 77k area right now.
【The nearby swing only hugs the current price】
After Aug 19, both sides moved away from the old endpoints. BTC pulled from 64163.6 to 81499.9, then back to 76888; on Aug 29 it snapped back to 78336.6. Current price at the time of writing: 77741.8; this candle’s high is 78183.4 and low is 77428.5.
ETH pulled from 1885.84 to 2566.46, then received 2405.83 on Aug 28. Current price at the time of writing: 2419.08; this candle’s low is 2406.97, and price is still pressing around that low.
The alternative ABC lands in the last few days. BTC’s four points are 77615.1, 81499.9, 76888, 78336.6. ETH is 2533.33, 2414.92, 2566.46, 2405.83. The score is only 2, for comparison only.
The nearby guide levels are calculated separately. BTC from 75559.5 to 81499.9: 0.618 ≈ 77829, and the current price sits just below it. A wider segment from 64163.6 to 81499.9: 0.382 ≈ 74877. ETH from 2356.19 to 2566.46: 0.618 ≈ 2437. From 1885.84 to 2566.46: 0.382 ≈ 2306.
【How to read the order book】
For the main count: once it’s through, it only means that the 5-wave set from early August has already finished. The nearby area has not yet had a new six-wave point that simultaneously passes all three hard rules, so the engine still keeps the old set as the primary position. When reading the current price, treat the main count as the backdrop, and the nearby highs/lows as the observation in progress. Use 4H closes—don’t read the intraday spikes.
BTC holds 76888, and you can treat this as consolidation in high territory. If consecutive 4H closes break below it, the next target is 75559; if that breaks, look at the comparison level 74877. For a rebound: first watch 78337, then 81499.9. As long as the prior highs aren’t recovered, don’t treat the nearby area as a new complete impulsive wave.
ETH first watches 2405. If it holds, then look above at 2437, and then 2566. If it closes below 2405, the next target is 2356; only after that breaks does 2306 become a real discussion.
【The real question】
Do you treat 77742 as the 0.618 pullback of the move from 75559 to 81499, or as the midpoint of the new ABC? For BTC or ETH, report your invalidation level.
$BTC $ETH #波浪理论 #BTC #ETH
Captain Dragonfly|A finance blogger who likes analyzing data and candlestick charts.
Not investment advice. Wave counting and water-level observations are only for structural comparison.