


Ethereum recently reclaimed the $2,400 level after a long stretch without meaningful upside, only to pull back almost immediately. Many traders are now asking whether this marks a return to the downtrend. Looking at funding rate data, the answer appears to be no — at least not yet.
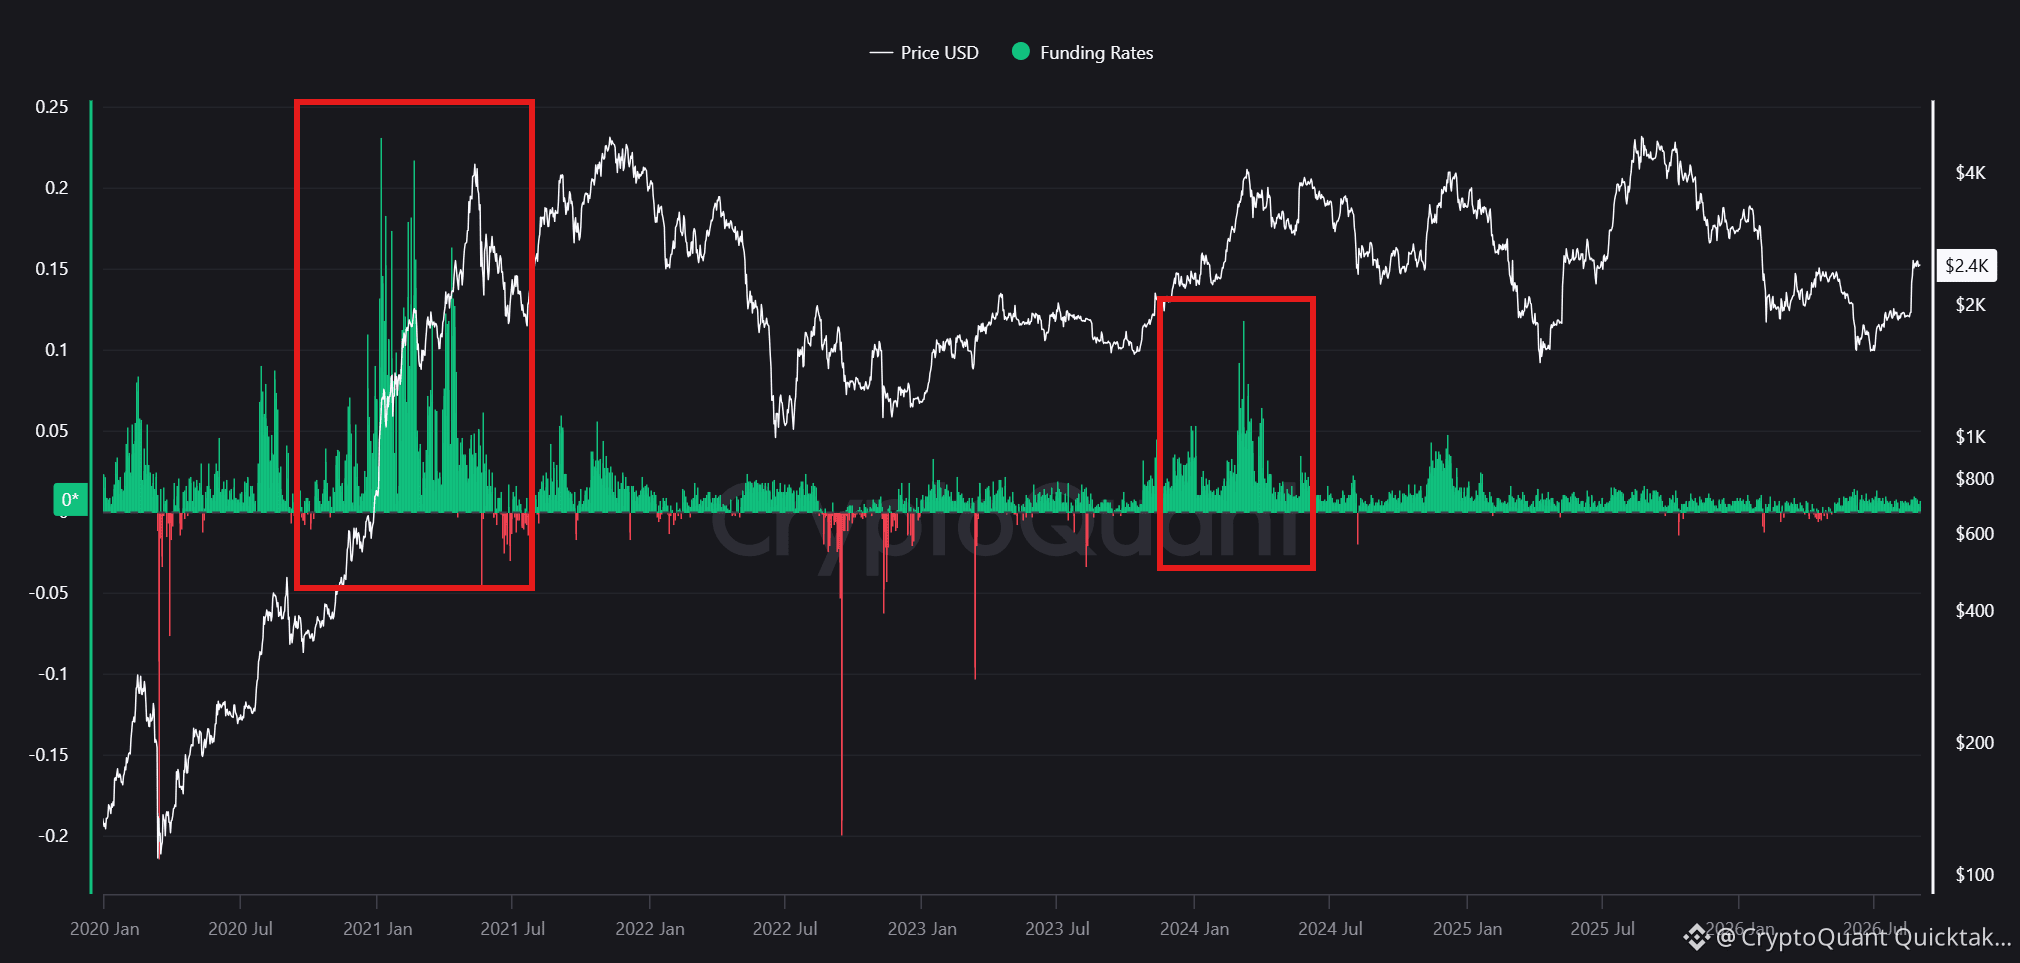
Start with the historical pattern. Looking at Ethereum funding rates across all exchanges since 2020, every major crash shared a common precursor: extreme funding rate spikes. In early-to-mid 2021, rates surged above 0.2 as long positions became dangerously crowded. In 2022 and 2023, the opposite extreme appeared — sharp plunges to -0.05 and even -0.1, reflecting violent liquidation cascades. Both patterns marked periods where the market had become structurally unbalanced, and both were followed by significant corrections.
The current chart tells a different story. Funding rates remain in a stable, moderate green range with no extreme spike in either direction. This suggests the market hasn't built up the kind of leveraged long exposure that historically preceded sharp liquidation-driven selloffs. Rather than a structural warning sign, the recent pullback looks more like a natural pause after a price rally.
To be fair, this reading isn't without risk. Funding rate is a lagging metric, and it can shift quickly if positioning changes fast. Should funding rates spike sharply in the coming days, the risk calculus would change. It's also worth cross-checking exchange-level funding divergence and derivatives-to-spot volume ratios before drawing firm conclusions.
Taken together, the current Ethereum pullback lacks the funding rate overheating pattern seen before past major crashes, so it looks more like short-term consolidation than the start of a deeper decline.
This reflects my own views. Not financial advice.
Written by Rich_dady