Are Candlestick Charts Useful? Unless the major player suddenly maliciously slams the market, yes—they’re useful. But don’t just watch whether prices go up or down; you need to read the intent behind it.
When you can understand these three secret lines, the market is like a movie with subtitles—everything in the plot is crystal clear.
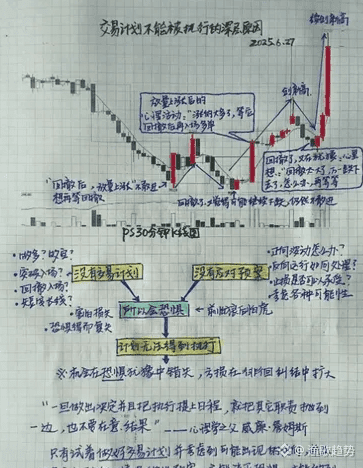
Last night, I posted a student’s notes in the Qun, and in half an hour it went viral!!
I’ve整理ed it below as a “first lesson” for new followers:
I watched candlestick charts for three years, and I finally understood one thing: candlestick charts themselves don’t “speak.” They only project the major player’s “inner voice” onto the screen. Want to predict the future by a few candles?
No. But if you can understand the major player’s secret code, at least you won’t be led by the nose.
I summarized three commonly used secret codes and share them with you.
Secret Code One: Fake Breakout, True Push-Up
The script usually goes like this: the price suddenly smashes through an important support, and the comment section instantly turns into misery. Seeing the break, retail traders all cut their losses. Meanwhile, the major player quietly picks up the chips, and before the close they pull the price back above that support again.
How to identify:
1. Look at the close. After the 1-hour candlestick breaks below support, the close comes back above it—most likely it’s a shakeout.
2. Look at volume. Big volume at the moment of the break, but reduced volume on the rebound—there are clear signs of “matched orders.”
Secret Code Two: The Volume-Price Divergence Alarm
Price makes a new high, but volume keeps shrinking—classic “fake prosperity.” Conversely, if price doesn’t move while volume suddenly expands, it’s often the major player secretly accumulating.
Last year I lost money on a certain popular coin: the daily chart made new highs, but trading volume was getting smaller day by day. In the end, three days later a single “head-chopping cleaver” wiped out the profits.
Secret Code Three: The Crisis of Sideways Consolidation at High Levels
Going sideways isn’t rest—it’s dividing the spoils. Sideways at the bottom: the major player is accumulating. Sideways at the top: the major player is distributing.
How to tell the difference:
1. Sideways at the bottom: volume increases moderately, and the bearish candles are quickly swallowed by bullish ones.
2. Sideways at the top: volume gradually shrinks, and bearish candles slowly swallow bullish ones. And once it’s accompanied by a sharp surge in open interest/position volume at the same time—then the storm is coming.
For classmates who don’t want to keep spinning in place: join the group chat with ID: yuge888 and see what schemes the major player is running again?👉@渔歌趋势
When you can understand these three secret lines, the market is like a movie with subtitles—everything in the plot is crystal clear.
Last night, I posted a student’s notes in the Qun, and in half an hour it went viral!!
I’ve整理ed it below as a “first lesson” for new followers:
I watched candlestick charts for three years, and I finally understood one thing: candlestick charts themselves don’t “speak.” They only project the major player’s “inner voice” onto the screen. Want to predict the future by a few candles?
No. But if you can understand the major player’s secret code, at least you won’t be led by the nose.
I summarized three commonly used secret codes and share them with you.
Secret Code One: Fake Breakout, True Push-Up
The script usually goes like this: the price suddenly smashes through an important support, and the comment section instantly turns into misery. Seeing the break, retail traders all cut their losses. Meanwhile, the major player quietly picks up the chips, and before the close they pull the price back above that support again.
How to identify:
1. Look at the close. After the 1-hour candlestick breaks below support, the close comes back above it—most likely it’s a shakeout.
2. Look at volume. Big volume at the moment of the break, but reduced volume on the rebound—there are clear signs of “matched orders.”
Secret Code Two: The Volume-Price Divergence Alarm
Price makes a new high, but volume keeps shrinking—classic “fake prosperity.” Conversely, if price doesn’t move while volume suddenly expands, it’s often the major player secretly accumulating.
Last year I lost money on a certain popular coin: the daily chart made new highs, but trading volume was getting smaller day by day. In the end, three days later a single “head-chopping cleaver” wiped out the profits.
Secret Code Three: The Crisis of Sideways Consolidation at High Levels
Going sideways isn’t rest—it’s dividing the spoils. Sideways at the bottom: the major player is accumulating. Sideways at the top: the major player is distributing.
How to tell the difference:
1. Sideways at the bottom: volume increases moderately, and the bearish candles are quickly swallowed by bullish ones.
2. Sideways at the top: volume gradually shrinks, and bearish candles slowly swallow bullish ones. And once it’s accompanied by a sharp surge in open interest/position volume at the same time—then the storm is coming.
For classmates who don’t want to keep spinning in place: join the group chat with ID: yuge888 and see what schemes the major player is running again?👉@渔歌趋势